ABSTRACT
The ‘gentan’ policy, an acreage reduction system, will be eliminated starting with rice harvested in 2018. The abolishment of the acreage reduction system aims at raising the competitiveness of Japanese rice making through encouraging uniqueness and creativity among rice growers in an unrestrained environment, in preparation for trade liberalization. However, whether it can increase rice’ competitiveness or not depends on whether it can increase its product differentiation or promote greater production efficiency. This paper examined whether promoting greater product differentiation can be created through product differentiation such as production location, variety and usage type that has been happening since the relaxation of price control in 1995. To do so, we examined data from 2005, 2010, 2015 Census of Agriculture and Forestry as well as annual data of relative price by production locations, varieties and purposes such as for household consumption or food industry use. We also argue that more production land area through accumulation is supposed to encourage more efficiency through economies of scale, however, farmers with 10 to 20 hectares farm land or management entities may not benefit from economies of scale. Competitiveness over production locations, varieties and purpose types may be lost if the government continues to subsidize feed rice. The paper explains why the ‘gentan’ policy should be discontinued.
INTRODUCTION
The gentan policy, an acreage reduction system, will be eliminated in 2018. Rice production was 735 million tons in 2017 under the policy (MAFF, 2018) and the amount of rice to be produced was calculated based on the domestic demand in order for rice supply not to exceed it. With the abolishment of the acreage reduction system, it removes the limitation of its production targeted at the domestic market and gears towards production for exporting purpose. Thus, the main aim of the policy is to increase the competitiveness of Japanese rice in preparation for liberalization of trade.
The state's long-term rice production adjustment policy has been implemented since 1970. The purpose of an acreage reduction system was two-pillared: it intended to avoid over-supply of rice which could lead to the reduction of rice price, and secondly the government wanted to reduce its deficit by purchasing rice at the higher price, then selling it at the lower price to the market. For the former, as they could see the further reduction of rice consumption per capita, the government wanted to prevent the foreseeable future oversupply and the consequential price reduction. A change over preference and taste of consumers diverted from consuming rice to other stable foods was the major driver of reduction of rice consumption. For the latter, all rice was bought by the State at the ‘fixed, flat and high rate and sold cheaper to the market. At that time, food control system guaranteed the price and government controlled rice price under The Staple Food Control Act. Government’s deficit was increasing. Thus, an acreage reduction system helped to keep the deficit not to increase. In return to the regulated reduction, farmers received the income-support subsidies for the area they did not produce rice. Thus, by not growing rice; they received the similar amount of compensation as if they produced rice. Thus, overall deficit continued and it discouraged differentiation of rice according to its characteristics.
Since Law for Stabilization of Supply, Demand and Prices of Staple Food was enacted and implemented in 1995, government’s control over price was abolished and a number of rice brands emerged. Some strengthened their rice unique characteristics over its production location, flavor, or its type of usage such as household use or food industry use. Even within rice varieties for household consumption, some varieties are tasty even when they are eaten cold. Such rice’s amylose content is around 15% and it does not get too dry and remain tasty even when it is cold. Such variety is welcomed as it is suitable for Japan’s “bento” (lunchbox) culture.
With the abolishment of the acreage control system, the national government is no longer in control over how much to produce. That is, municipalities will take over the control and set production targets at each prefecture level. Although it is a target and no penalty is imposed, it is likely that no sudden increase of production is expected. This set target may not be accurate if they only focus on domestic demand and do not take into consideration the future demand for exporting.
Furthermore, the government will continue subsidies of feed rice. The ‘gentan’ policy’s second pillar of provision of subsidies is not ending. The government will abolish the direct payment grant (7,500 yen / 10a) of rice that was delivered to producers who achieved production quantity targets) while the same amount JPY 75,000/ha (approx. US$ 673/ha) is compensated if you produce feed rice instead of food rice for human consumption .
Whether Japan's rice market can increase competitiveness or not depends on whether it can increase its product differentiation or promote greater production efficiency. Promoting greater product differentiation can be created through production location, variety, usage types, organic farming and branding and agricultural diversification. For greater production efficiency, we need to enhance economies of scale as well as learning by doing. One important question is whether rice could be oversupplied with the abolishment of acreage reduction system. To answer this question, we examine from two aspects; whether rice product differentiation is increasing in terms of production location, variety and usage types. Another aspect to examine is whether rice production land area per farmer or management entity is increasing. The structure of the paper is as follows: In the second section, we illustrate the change of rice price according to rice’s purpose types to reflect the first aspect of efficiency. In the third section, we illustrate the change of the agricultural land areas and new entrants 2005, 2010 and 2015 from Census data to reflect the second aspect of efficiency.
Aspects of the change of rice price through its product differentiation
A traditional way for promoting rice’ product differentiation is through production location. Fig. 1 shows change of rice acreage as of April, 2018. From this year’s production, there is no obligation of meeting the target reduced acreage. There are six prefectures that increased acreage of rice production and seven prefectures that reduced. In the main rice production region, Tohoku and Hokuriku, increased its acreage of rice production. This already indicates that producers in the region are already following some sort of market mechanism.
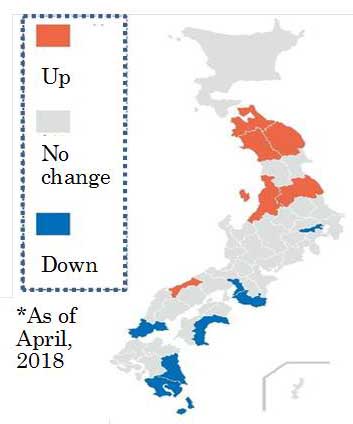
Fig. 1. Change of rice acreage
Uniqueness and creativity leads to branding of rice. Recent trend indicate that further product differentiation can be achieved by knowing which variety is being produced and for what purpose. In the past, Koshihikari is the most famous variety in Japan. Koshihikari used to be pronominalized for rice of Niigata prefecture. Today, Koshihikari is produced all over Japan. Table 1 shows a descriptive summary of Koshihikari rice price change from 2013 to 2015. The price is per 60 kg. The price of Koshihikari varies from minimum price of JPN 11,634 to 21,125 (USD1 103.88 to 188.61)in 2013. Even the relative price has reduced a little, the sale value of Koshihikari varies from JPN 14,318 to 20,719 (USD 127.84 to 184.99) . The most famous production location called Uonuma, Niigata marks the highest price Koshihikari. On the other hand, the minimum price Koshihikari is almost JPN 6000 (USD 53.57) difference compared to the highest price. Also, with the 95% confidence interval (C.I.), the rice price is between JPN 15,264 and 16,018 (USD 136.29 to 143.02).
Table 1. Descriptive summary of Koshihikari brand rice relative price change
(N=37) (price per 60kg)
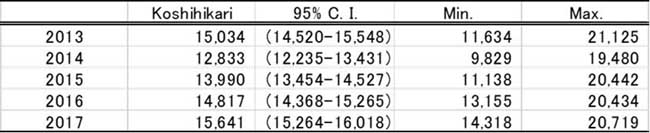
Note: Data from Crop Production Policy Planning Division, Crop Production Bureau
In fact, Tohoku produces rice brand varieties other than Koshihikari. Table 2 shows relative price of 2013-2017. Some varieties that were recently developed and appeared in the market have even higher relative sale price. The relative price of Yumepirica produced in Hokkaido is JPY 16,668 (USD 148.82) and that of Tsuruhime of Yamagata is JPY 17,544 (USD 156.64). That is more expensive than general price of Niigata Koshihikari which is JPY 16,285 (145.40).
Table 2. Relative price change of rice brand varieties 2013-2017
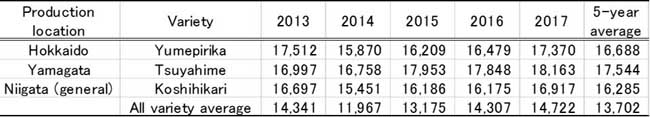
Note: Data from Crop Production Policy Planning Division, Crop Production Bureau
Also, generally there are 3 types of purposes for rice: 1) household use, 2) food industry such as rice used by restaurants, supermarkets, convenience stores, and lunchbox companies, and finally 3) for feed. Both household use and food industry use are both for human consumption, however, food industry use varieties have slightly lower relative prices and often for that reason, industry preferred the varieties. It is like the prescription of medicine. Food industry use rice is generic that it has almost the same flavor and textures, but relatively cheaper than other rice brand varieties.
Table 3 shows descriptive summary of food industry rice varieties’ relative price change over the 2013-2017 period. Price of food industry also varies from minimum price of JPN 11, 638 to 14,787 (USD 103.91 to 132.03) in 2013. Notice that the minimum price of food industry variety is similar to that of Koshihikari brand rice in Table 1. Maximum prime price is much higher for brand Koshihikari, however Koshihikari produced in production location other than Niigata prefecture has similar price to the relative price of food industry varieties. Also, with the 95% confidence interval (C.I.), the rice price of food industry use is between JPN 13,714 and 15,722 (USD 122.45 to 140.38) in 2017.
Table 3. Descriptive summary of food industry rice varieties’ relative price change
(N=16) (60kg)
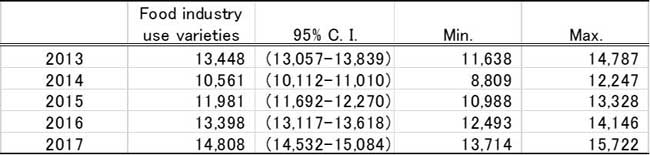
Note: Data from Crop Production Policy Planning Division, Crop Production Bureau
Below is relative price change of food industry rice varieties 2013-2017. Notice that food industry rice varieties are produced in Hokkaido and Prefectures of Tohoku region such as Aomori and Hokuriku region such as Toyama. Also, Koshihikari produced in Tochigi is one of the high end food industry use rice.
Table 4. Relative price change of food industry rice varieties 2013-2017
.jpg)
Note: Data from Crop Production Policy Planning Division, Crop Production Bureau
From these comparisons, production location, variety and purpose type created different markets across rice varieties. As mentioned in Table 4, even if the Koshihikari, production location is Tochigi, then it is considered as high end part of the food industry which use rice so the purpose type provides further sub-classification of rice markets.
However, product differentiation is a little muddled in the last few years. Fig. 2 depicts the problem. Dark line is the relative price change of household use brand rice (Koshihikari) and lighter dark line is food industry use rice (multiple varieties described in Table 4). Notice that the relative price of household use rice was significantly higher than that of food industry use rice at 95% significant level. It was the case from 2013 to 2016. However, statistically since 2017, the relative prices of two purpose types have not been significantly different.
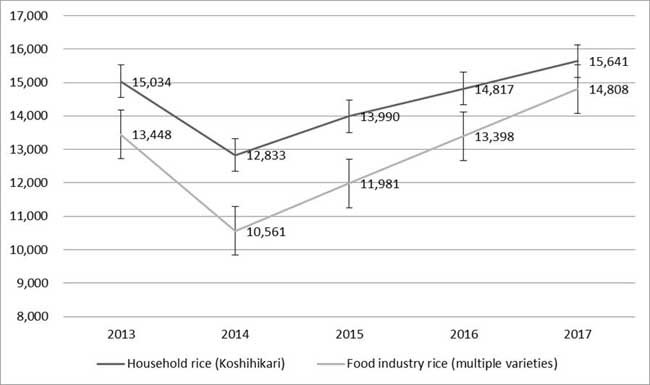
Fig. 2. The relative prices of household use rice and food industry use rice
Note: Data from Crop Production Policy Planning Division, Crop Production Bureau
That is because the food industry uses rice in facing a shortage. It is reported that in 2015, about 130 million hectare-of food industry rice is short. On the other hand, there was an over supply of household use rice planted to about 130 million hectares. Prior to 2016, the two types of rice varieties were considered to be different products and it was shown as prices were statistically different at 95% significant level. However, since both do not meet the current demand required, household use rice relative price has been reduced and the food industry price of rice has increased in 2017. This phenomenon is continuing this year. Thus, the rice acreages change shown in Figure 1, in a sense, indicates that those production locations that increased acreage are producing more rice. Still the market of food industry rice is facing supply shortage whereas the production location that decreased is reducing its production as their household use rice does not have product differentiation in terms of production location, variety and type. Although as long as subsidies on feed rice are continued, the real competitive market situation cannot be created, we can already see that market is working by itself and this trend will be continued.
The shortage of food industry use rice is caused by subsidies for feed rice and whole crop silage (WCS)2. Table 5 shows comparison of balance of payment of rice production among household use, food industry use, feed, and WCS. Feed rice has most subsidies from the government and local municipality. Besides direct payment to cultivate an alternative crop of JPY 80000 (USD 714.29), if yield is 150 kg/10 are or more, farmer can get JPY 15,000 (USD 133.93) more. If farmers use local varieties, they can receive JPY 12,000 (USD 107.14). Since it is a rice for feed which is in cooperation with animal husbandry, farmers will receive JPY 13,000 (USD 116.07). The farmers who produces feed rice receive JPY 30,165 (USD 269.33 ) per 10 are and if it reaches the yields of 700 kg/10 are, then the amount they receive can increase to JPY 45,165 (USD 403.26) per 10 are.
Table 5. Balance of payment for household use, food industry use, feed, and WCS
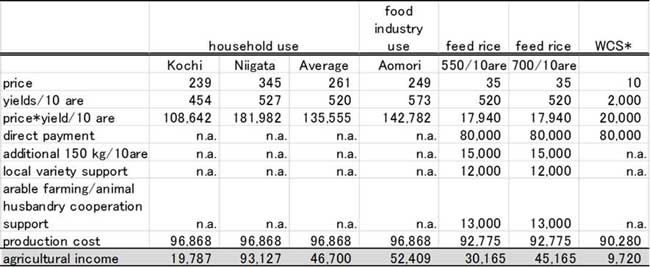
Note: author produced based on price and yields information from MAFF, 2018 and production cost from Fukuda
In the case of Kochi Prefecture, both the relative price and yields per 10are are not as high as that of other prefectures. At that time, the agricultural income becomes JPY 19,787 (USD 176.67). Kochi is one of seven prefectures that reduced the production acreage in 2018. In the case of Aomori prefecture, on the other hand, food industry rice is well produced. Both the relative price and yields per hectare are better than even that of human consumption rice average. Aomori is one of the six prefectures that increased production acreage in 2018. In the case of Niigata, the location of the data is Uonuma, which is the most famous Koshihikari brand rice. Some prefectures have their own prefecture brand and city level support up to JPY 10,000.
Fig. 3 illustrates that revenue from household use or food industry rice is less than JPY 30,165 (USD 269.33), such farmers are motivated to shift their cultivation from human consumption rice to feed rice. For both household use and food industry use, when their agricultural income is below the income of feed rice, they shift to feed rice. Since the relative price of food industry use rice is cheaper than household use rice, farmers feel incentive for producing feed rice unless yields per 10are are high. Thus, food industry use rice continues facing shortages. Creating higher yield food industry rice or reduction of the amount of direct payment on feed rice should be necessary in order for food rice to have higher agricultural income relative to that of feed rice.
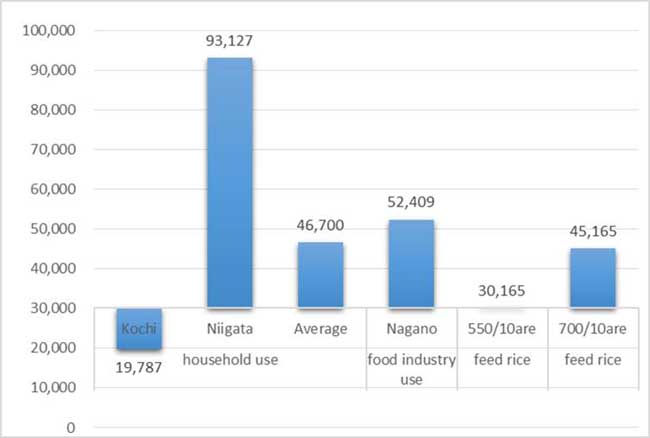
Fig. 3. Rice prices in relation to feed rice price per 550 kg/10are feed rice
Aspects of Management entity and Rice production land area
Efficiency through economies of scale can be achieved by aggregating agricultural land areas. Also, the fact that more actors other than farmers can engage in farming and manage a larger scale of production, it is also promoting efficiency. The government reviewed the requirements for corporations that possess farmlands in 2016. It aimed to make it easier for corporations to develop business by measuring agricultural diversification. In addition, in order to clarify that it is a requirement of a corporation possessing farmlands, the government changed the managing entity from agricultural production cooperation to Qualified Farmland Owned Corporation (formally known as Farming Corporation) to reflect its eligibility that they are qualified to acquire or own farmlands.
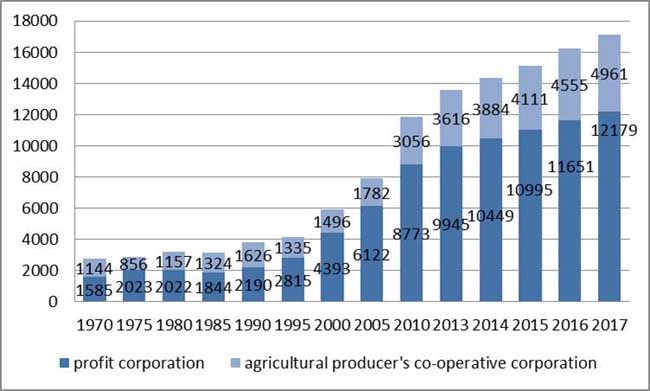
Fig. 4. Change of the number of Qualified Farmland Owned Corporation
Note: Figs. are from annual data of the Management Improvement Bureau, MAFF
Fig. 4 shows the entry of companies into the agricultural field is spreading. The corporation management entities have two types; profit corporation type and agricultural producer’s co-operative corporation. A corporation, a joint-venture company, a joint-stock company, and a joint-stock company are corporations prescribed in the Corporate Law, each of which is a corporation aimed at conducting commercial activities. It is generally said to be a "profit corporation". On the other hand, agricultural producer’s co-operative corporation is an association type corporation, prescribed in the Agricultural Cooperative Association Act. It is a corporation aimed at the joint interests of Agricultural Cooperative’s members by making cooperative agricultural production activities and setting up facilities for joint use. It is said that it is an intermediate corporation between a profit corporation and a public benefit corporation and is generally said to be an "intermediate corporation".
Since the 2009 revision of the Agricultural Land Law, in 2005, the number of profit corporations was 6,122 and the number of agricultural producer’s co-operative corporations was 1,782. By 2017, the number increased to 12,179 and 4,961, respectively. In terms of number, profit corporation type is larger than agricultural producer’s cooperative corporation. However, when we make 2005 as 1, the increase ratio is higher for agricultural producer’s cooperative corporation (Fig. 5). The number of agricultural producer’s cooperative corporation increased by 2.78 whereas profit corporation increased by 1.99.
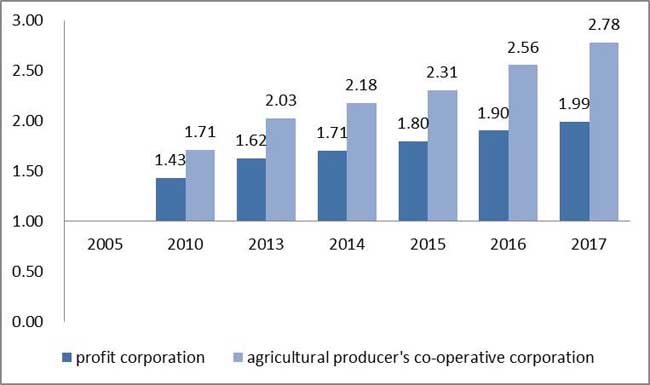
Fig. 5. The number of agricultural producer’s cooperative corporation
Note: Figures are from annual data of the Management Improvement Bureau, MAFF
Also, the number of farmers that own 100 hectares increased compared to 2005. Again, having 2005 Census data as 1, the number of farmers with less than one hectare and more than one hectares as well as less than five hectares decreased by 0.63 and 0.69, respectively. On the other hand, those who have more than hundred hectare increased by 1.84. Ishii (2018) also confirms that the aggregation of land area will continue.
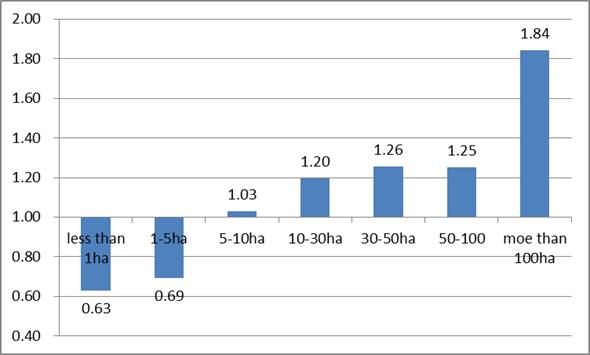
Fig. 6. Changes of Farming Land Area in 2015 compared to 2005
Note: Figures are from the 2015 Census of Agriculture and Forestry
However, still the largest proportion of farmers own less than one hectare. In 2005, such farmer with less than one hectare was 57.26%. It became 53.28%, reduced by 3.28%, however it is still the largest proportion of farmers. The number of farmers who own between one and five hectares increased slightly, 38.07% in 2005 and 39% in 2015.
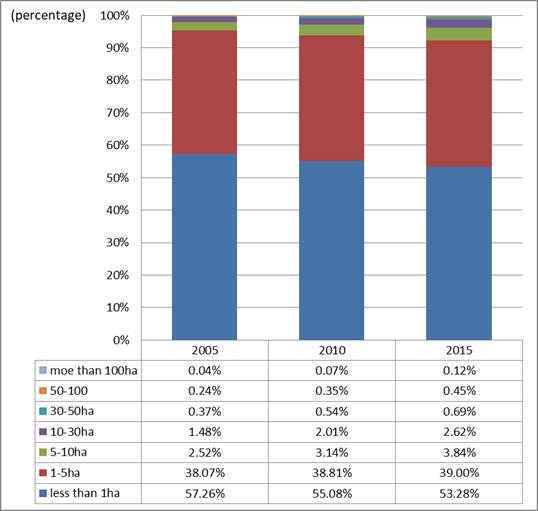
Fig. 7. Proportion of farm acreages
Note: Figures are from the 2015 Census of Agriculture and Forestry
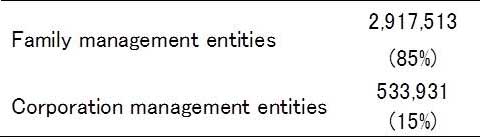
In 2015, cultivated land by family management entity is 85% and 15% by corporation management entities. This trend is expected to continue.
Table 6. Cultivated land under management in 2015
Note: Figures are from the 2015 Census of Agriculture and Forestry
In terms of agricultural income, however, it is not necessary that small-scale farmers are losing profits compared to larger land-size farmers. Farmers in Table 7 are producing rice as their main agricultural crop. Farmers with less than ten hectares are making profits in 2015 8% more than in 2010. On the other hand, farmers who are producing between 10 and 20 hectares are losing most of their profits in 2015 compared to 2010. Farmers with 20 and 50 hectares have fewer profits in 2015 than in 2010. Finally, farmers who are producing more than 50 hectares are making profits again. Those who are small-scale farmers with less than 10 hectares could be making profits through product differentiation such as environmentally friendly farming or branding. Farmers who are producing between ten and twenty hectares do not make profits even with subsidies.
Thus, facing with the situation that farmers with 10 to 20 hectares who might leave farming in the near future, both farmers and corporations that acquire such lands are necessary. In 2014, an agricultural land bank was created (Hirasawa, 2014). If matching goes well, farmers or corporations will increase their production acreages and increase efficiency. If it does not, then the abandoned acreages could increase.
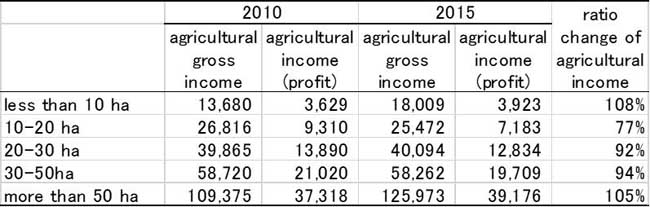
Table 7. Changes in agricultural gross income and agricultural income by management size of entity (1,000 yen)
Note: Figures are from the 2010 and 2015 Census of Agriculture and Forestry
CONCLUSION
The state's long-term rice production adjustment policy ‘gentan’ was abolished from rice harvested in 2018. The purpose of the abolishment is to increase competitiveness of rice in Japan. For promotion of competitiveness, product differentiation should be necessary in terms of production locations, varieties and purpose types. Also, competitiveness could be promoted with further efficiency through land accumulation. We reviewed the current status of competitiveness of rice for domestic market from aspects of the change of rice price through its product differentiation and from aspects of management entity and rice production land areas.
The issue of excessive stock does not apply uniformly on a nationwide basis. Product differentiation within rice has been happening through production locations, varieties and purpose types. In terms of household use and food industry use, product differentiation was evident from the price difference until 2016. However, since the announcement of the abolishment of rice production acreage reduction system, the government also promoted direct payment support for feed rice. Although this has also a good intention to make domestic animal husbandry with provision of domestic feed, this has subsequently influenced the relative prices of household use and food industry use rice. In 2017, we no longer see any price difference between two human consumption rice. In particular, rice shortage of food industry rice is pushing up its price. What is happening should be those who are producing household use rice shift their production to food industry rice. However, this volatility of human consumption rice may shift farmers to produce feed rice which is stable with subsidies, even further.
Also, for promotion of production efficiency, changes over the number of other management entity, so called Qualified Land Owned Corporation (formally known as Farming Cooperative), is increasing and the total land area per farmer or other management entity has been confirmed. At the same time, however, we have observed not necessarily all farmers or other entities are benefiting from enlarging their land areas. Land areas between 10 and 20 hectares have not captured the opportunity to increase their agricultural income from 2010 to 2015. Unless they become profitable farmers, they will likely leave from the market in the near future. At that time, unless matching of land lease goes well, further abandoned land could increase.
More than 1,000 joint-stock companies have leased agricultural land through Agricultural Land Bank scheme, but matching is necessary for 10 to 20 hectares of land sized farms that are not making agriculture income and likely to leave the market in the near future.
Finally, supporting a maturing infant industry, rice feed market, in this context is necessary as it is just emerging market to grow. However, gradual reduction of the amount of direct payment which still applies to ‘rice’ farmers in Japan is necessary for promoting competitiveness which is the aim of the abolishment of ‘gentan’. Creating higher yield food industry rice or reduction of the amount of direct payment on feed rice should be necessary in order for food rice to have higher agricultural income relative to that of feed rice. Otherwise, we continued to face shortage of food industry rice and lose competitiveness of household use rice. If they keep ‘protecting’ rice farmers from competition in the market, subsidies on feed rice should be eventually faded away or competitiveness of human consumption rice may be lost. Whether rice could be oversupplied with the abolishment of acreage reduction system depends on the timing of the end of the ‘gentan’ second pillar, i.e. subsidies.
REFERENCES
MAFF, "2005 Census of Agriculture and Forestry"
MAFF, "2010 Census of Agriculture and Forestry"
MAFF, "2015 Census of Agriculture and Forestry"
MAFF, Annual data, the Management Improvement Bureau, MAFF
MAFF, Annual data, the Crop Production Policy Planning Division, Crop Production Bureau, MAFF
Ishii, R. (2018) ‘Nogyo no Seicho Sangyo ka heno hanten no shinario- Shiga ken wo ke-su ni’ (the scenario to make agriculture as growing industry – case of Shiga prefecture), Spring / Feb. 2018 / No.415
Fukuda, S. (2015) Ine SGS no Niku Yo Gyu Hanshoku Keiei deno riryo jittaito fukyu kakudai jyoken (Conditions for extension of and the current usage status of rice Soft Grain Silage (SGS) under beef cow breeding farm management), Chikusan no Jyoho, Livestock industries information, (311), 35-41.
|
Date submitted: July 30, 2018
Reviewed, edited and uploaded: Oct. 19, 2018
|
1 We converted JPY 112 to USD 1 (the currency exchange as of 2018/10/14
2 WCS of rice is used as forage for dairy cows. Whole crop rice was harvested 120 days after planting and chopped to 2-3-cm length for silage making.

End of ‘Gentan’ -Will the End of Regulated Reduction of Cultivated Land Result in the Increase or Decrease of Future Rice Supply in Japan?
ABSTRACT
The ‘gentan’ policy, an acreage reduction system, will be eliminated starting with rice harvested in 2018. The abolishment of the acreage reduction system aims at raising the competitiveness of Japanese rice making through encouraging uniqueness and creativity among rice growers in an unrestrained environment, in preparation for trade liberalization. However, whether it can increase rice’ competitiveness or not depends on whether it can increase its product differentiation or promote greater production efficiency. This paper examined whether promoting greater product differentiation can be created through product differentiation such as production location, variety and usage type that has been happening since the relaxation of price control in 1995. To do so, we examined data from 2005, 2010, 2015 Census of Agriculture and Forestry as well as annual data of relative price by production locations, varieties and purposes such as for household consumption or food industry use. We also argue that more production land area through accumulation is supposed to encourage more efficiency through economies of scale, however, farmers with 10 to 20 hectares farm land or management entities may not benefit from economies of scale. Competitiveness over production locations, varieties and purpose types may be lost if the government continues to subsidize feed rice. The paper explains why the ‘gentan’ policy should be discontinued.
INTRODUCTION
The gentan policy, an acreage reduction system, will be eliminated in 2018. Rice production was 735 million tons in 2017 under the policy (MAFF, 2018) and the amount of rice to be produced was calculated based on the domestic demand in order for rice supply not to exceed it. With the abolishment of the acreage reduction system, it removes the limitation of its production targeted at the domestic market and gears towards production for exporting purpose. Thus, the main aim of the policy is to increase the competitiveness of Japanese rice in preparation for liberalization of trade.
The state's long-term rice production adjustment policy has been implemented since 1970. The purpose of an acreage reduction system was two-pillared: it intended to avoid over-supply of rice which could lead to the reduction of rice price, and secondly the government wanted to reduce its deficit by purchasing rice at the higher price, then selling it at the lower price to the market. For the former, as they could see the further reduction of rice consumption per capita, the government wanted to prevent the foreseeable future oversupply and the consequential price reduction. A change over preference and taste of consumers diverted from consuming rice to other stable foods was the major driver of reduction of rice consumption. For the latter, all rice was bought by the State at the ‘fixed, flat and high rate and sold cheaper to the market. At that time, food control system guaranteed the price and government controlled rice price under The Staple Food Control Act. Government’s deficit was increasing. Thus, an acreage reduction system helped to keep the deficit not to increase. In return to the regulated reduction, farmers received the income-support subsidies for the area they did not produce rice. Thus, by not growing rice; they received the similar amount of compensation as if they produced rice. Thus, overall deficit continued and it discouraged differentiation of rice according to its characteristics.
Since Law for Stabilization of Supply, Demand and Prices of Staple Food was enacted and implemented in 1995, government’s control over price was abolished and a number of rice brands emerged. Some strengthened their rice unique characteristics over its production location, flavor, or its type of usage such as household use or food industry use. Even within rice varieties for household consumption, some varieties are tasty even when they are eaten cold. Such rice’s amylose content is around 15% and it does not get too dry and remain tasty even when it is cold. Such variety is welcomed as it is suitable for Japan’s “bento” (lunchbox) culture.
With the abolishment of the acreage control system, the national government is no longer in control over how much to produce. That is, municipalities will take over the control and set production targets at each prefecture level. Although it is a target and no penalty is imposed, it is likely that no sudden increase of production is expected. This set target may not be accurate if they only focus on domestic demand and do not take into consideration the future demand for exporting.
Furthermore, the government will continue subsidies of feed rice. The ‘gentan’ policy’s second pillar of provision of subsidies is not ending. The government will abolish the direct payment grant (7,500 yen / 10a) of rice that was delivered to producers who achieved production quantity targets) while the same amount JPY 75,000/ha (approx. US$ 673/ha) is compensated if you produce feed rice instead of food rice for human consumption .
Whether Japan's rice market can increase competitiveness or not depends on whether it can increase its product differentiation or promote greater production efficiency. Promoting greater product differentiation can be created through production location, variety, usage types, organic farming and branding and agricultural diversification. For greater production efficiency, we need to enhance economies of scale as well as learning by doing. One important question is whether rice could be oversupplied with the abolishment of acreage reduction system. To answer this question, we examine from two aspects; whether rice product differentiation is increasing in terms of production location, variety and usage types. Another aspect to examine is whether rice production land area per farmer or management entity is increasing. The structure of the paper is as follows: In the second section, we illustrate the change of rice price according to rice’s purpose types to reflect the first aspect of efficiency. In the third section, we illustrate the change of the agricultural land areas and new entrants 2005, 2010 and 2015 from Census data to reflect the second aspect of efficiency.
Aspects of the change of rice price through its product differentiation
A traditional way for promoting rice’ product differentiation is through production location. Fig. 1 shows change of rice acreage as of April, 2018. From this year’s production, there is no obligation of meeting the target reduced acreage. There are six prefectures that increased acreage of rice production and seven prefectures that reduced. In the main rice production region, Tohoku and Hokuriku, increased its acreage of rice production. This already indicates that producers in the region are already following some sort of market mechanism.
Fig. 1. Change of rice acreage
Uniqueness and creativity leads to branding of rice. Recent trend indicate that further product differentiation can be achieved by knowing which variety is being produced and for what purpose. In the past, Koshihikari is the most famous variety in Japan. Koshihikari used to be pronominalized for rice of Niigata prefecture. Today, Koshihikari is produced all over Japan. Table 1 shows a descriptive summary of Koshihikari rice price change from 2013 to 2015. The price is per 60 kg. The price of Koshihikari varies from minimum price of JPN 11,634 to 21,125 (USD1 103.88 to 188.61)in 2013. Even the relative price has reduced a little, the sale value of Koshihikari varies from JPN 14,318 to 20,719 (USD 127.84 to 184.99) . The most famous production location called Uonuma, Niigata marks the highest price Koshihikari. On the other hand, the minimum price Koshihikari is almost JPN 6000 (USD 53.57) difference compared to the highest price. Also, with the 95% confidence interval (C.I.), the rice price is between JPN 15,264 and 16,018 (USD 136.29 to 143.02).
Table 1. Descriptive summary of Koshihikari brand rice relative price change
(N=37) (price per 60kg)
Note: Data from Crop Production Policy Planning Division, Crop Production Bureau
In fact, Tohoku produces rice brand varieties other than Koshihikari. Table 2 shows relative price of 2013-2017. Some varieties that were recently developed and appeared in the market have even higher relative sale price. The relative price of Yumepirica produced in Hokkaido is JPY 16,668 (USD 148.82) and that of Tsuruhime of Yamagata is JPY 17,544 (USD 156.64). That is more expensive than general price of Niigata Koshihikari which is JPY 16,285 (145.40).
Table 2. Relative price change of rice brand varieties 2013-2017
Note: Data from Crop Production Policy Planning Division, Crop Production Bureau
Also, generally there are 3 types of purposes for rice: 1) household use, 2) food industry such as rice used by restaurants, supermarkets, convenience stores, and lunchbox companies, and finally 3) for feed. Both household use and food industry use are both for human consumption, however, food industry use varieties have slightly lower relative prices and often for that reason, industry preferred the varieties. It is like the prescription of medicine. Food industry use rice is generic that it has almost the same flavor and textures, but relatively cheaper than other rice brand varieties.
Table 3 shows descriptive summary of food industry rice varieties’ relative price change over the 2013-2017 period. Price of food industry also varies from minimum price of JPN 11, 638 to 14,787 (USD 103.91 to 132.03) in 2013. Notice that the minimum price of food industry variety is similar to that of Koshihikari brand rice in Table 1. Maximum prime price is much higher for brand Koshihikari, however Koshihikari produced in production location other than Niigata prefecture has similar price to the relative price of food industry varieties. Also, with the 95% confidence interval (C.I.), the rice price of food industry use is between JPN 13,714 and 15,722 (USD 122.45 to 140.38) in 2017.
Table 3. Descriptive summary of food industry rice varieties’ relative price change
(N=16) (60kg)
Note: Data from Crop Production Policy Planning Division, Crop Production Bureau
Below is relative price change of food industry rice varieties 2013-2017. Notice that food industry rice varieties are produced in Hokkaido and Prefectures of Tohoku region such as Aomori and Hokuriku region such as Toyama. Also, Koshihikari produced in Tochigi is one of the high end food industry use rice.
Table 4. Relative price change of food industry rice varieties 2013-2017
Note: Data from Crop Production Policy Planning Division, Crop Production Bureau
From these comparisons, production location, variety and purpose type created different markets across rice varieties. As mentioned in Table 4, even if the Koshihikari, production location is Tochigi, then it is considered as high end part of the food industry which use rice so the purpose type provides further sub-classification of rice markets.
However, product differentiation is a little muddled in the last few years. Fig. 2 depicts the problem. Dark line is the relative price change of household use brand rice (Koshihikari) and lighter dark line is food industry use rice (multiple varieties described in Table 4). Notice that the relative price of household use rice was significantly higher than that of food industry use rice at 95% significant level. It was the case from 2013 to 2016. However, statistically since 2017, the relative prices of two purpose types have not been significantly different.
Fig. 2. The relative prices of household use rice and food industry use rice
Note: Data from Crop Production Policy Planning Division, Crop Production Bureau
That is because the food industry uses rice in facing a shortage. It is reported that in 2015, about 130 million hectare-of food industry rice is short. On the other hand, there was an over supply of household use rice planted to about 130 million hectares. Prior to 2016, the two types of rice varieties were considered to be different products and it was shown as prices were statistically different at 95% significant level. However, since both do not meet the current demand required, household use rice relative price has been reduced and the food industry price of rice has increased in 2017. This phenomenon is continuing this year. Thus, the rice acreages change shown in Figure 1, in a sense, indicates that those production locations that increased acreage are producing more rice. Still the market of food industry rice is facing supply shortage whereas the production location that decreased is reducing its production as their household use rice does not have product differentiation in terms of production location, variety and type. Although as long as subsidies on feed rice are continued, the real competitive market situation cannot be created, we can already see that market is working by itself and this trend will be continued.
The shortage of food industry use rice is caused by subsidies for feed rice and whole crop silage (WCS)2. Table 5 shows comparison of balance of payment of rice production among household use, food industry use, feed, and WCS. Feed rice has most subsidies from the government and local municipality. Besides direct payment to cultivate an alternative crop of JPY 80000 (USD 714.29), if yield is 150 kg/10 are or more, farmer can get JPY 15,000 (USD 133.93) more. If farmers use local varieties, they can receive JPY 12,000 (USD 107.14). Since it is a rice for feed which is in cooperation with animal husbandry, farmers will receive JPY 13,000 (USD 116.07). The farmers who produces feed rice receive JPY 30,165 (USD 269.33 ) per 10 are and if it reaches the yields of 700 kg/10 are, then the amount they receive can increase to JPY 45,165 (USD 403.26) per 10 are.
Table 5. Balance of payment for household use, food industry use, feed, and WCS
Note: author produced based on price and yields information from MAFF, 2018 and production cost from Fukuda
In the case of Kochi Prefecture, both the relative price and yields per 10are are not as high as that of other prefectures. At that time, the agricultural income becomes JPY 19,787 (USD 176.67). Kochi is one of seven prefectures that reduced the production acreage in 2018. In the case of Aomori prefecture, on the other hand, food industry rice is well produced. Both the relative price and yields per hectare are better than even that of human consumption rice average. Aomori is one of the six prefectures that increased production acreage in 2018. In the case of Niigata, the location of the data is Uonuma, which is the most famous Koshihikari brand rice. Some prefectures have their own prefecture brand and city level support up to JPY 10,000.
Fig. 3 illustrates that revenue from household use or food industry rice is less than JPY 30,165 (USD 269.33), such farmers are motivated to shift their cultivation from human consumption rice to feed rice. For both household use and food industry use, when their agricultural income is below the income of feed rice, they shift to feed rice. Since the relative price of food industry use rice is cheaper than household use rice, farmers feel incentive for producing feed rice unless yields per 10are are high. Thus, food industry use rice continues facing shortages. Creating higher yield food industry rice or reduction of the amount of direct payment on feed rice should be necessary in order for food rice to have higher agricultural income relative to that of feed rice.
Fig. 3. Rice prices in relation to feed rice price per 550 kg/10are feed rice
Aspects of Management entity and Rice production land area
Efficiency through economies of scale can be achieved by aggregating agricultural land areas. Also, the fact that more actors other than farmers can engage in farming and manage a larger scale of production, it is also promoting efficiency. The government reviewed the requirements for corporations that possess farmlands in 2016. It aimed to make it easier for corporations to develop business by measuring agricultural diversification. In addition, in order to clarify that it is a requirement of a corporation possessing farmlands, the government changed the managing entity from agricultural production cooperation to Qualified Farmland Owned Corporation (formally known as Farming Corporation) to reflect its eligibility that they are qualified to acquire or own farmlands.
Fig. 4. Change of the number of Qualified Farmland Owned Corporation
Note: Figs. are from annual data of the Management Improvement Bureau, MAFF
Fig. 4 shows the entry of companies into the agricultural field is spreading. The corporation management entities have two types; profit corporation type and agricultural producer’s co-operative corporation. A corporation, a joint-venture company, a joint-stock company, and a joint-stock company are corporations prescribed in the Corporate Law, each of which is a corporation aimed at conducting commercial activities. It is generally said to be a "profit corporation". On the other hand, agricultural producer’s co-operative corporation is an association type corporation, prescribed in the Agricultural Cooperative Association Act. It is a corporation aimed at the joint interests of Agricultural Cooperative’s members by making cooperative agricultural production activities and setting up facilities for joint use. It is said that it is an intermediate corporation between a profit corporation and a public benefit corporation and is generally said to be an "intermediate corporation".
Since the 2009 revision of the Agricultural Land Law, in 2005, the number of profit corporations was 6,122 and the number of agricultural producer’s co-operative corporations was 1,782. By 2017, the number increased to 12,179 and 4,961, respectively. In terms of number, profit corporation type is larger than agricultural producer’s cooperative corporation. However, when we make 2005 as 1, the increase ratio is higher for agricultural producer’s cooperative corporation (Fig. 5). The number of agricultural producer’s cooperative corporation increased by 2.78 whereas profit corporation increased by 1.99.
Fig. 5. The number of agricultural producer’s cooperative corporation
Note: Figures are from annual data of the Management Improvement Bureau, MAFF
Also, the number of farmers that own 100 hectares increased compared to 2005. Again, having 2005 Census data as 1, the number of farmers with less than one hectare and more than one hectares as well as less than five hectares decreased by 0.63 and 0.69, respectively. On the other hand, those who have more than hundred hectare increased by 1.84. Ishii (2018) also confirms that the aggregation of land area will continue.
Fig. 6. Changes of Farming Land Area in 2015 compared to 2005
Note: Figures are from the 2015 Census of Agriculture and Forestry
However, still the largest proportion of farmers own less than one hectare. In 2005, such farmer with less than one hectare was 57.26%. It became 53.28%, reduced by 3.28%, however it is still the largest proportion of farmers. The number of farmers who own between one and five hectares increased slightly, 38.07% in 2005 and 39% in 2015.
Fig. 7. Proportion of farm acreages
Note: Figures are from the 2015 Census of Agriculture and Forestry
In 2015, cultivated land by family management entity is 85% and 15% by corporation management entities. This trend is expected to continue.
Table 6. Cultivated land under management in 2015
Note: Figures are from the 2015 Census of Agriculture and Forestry
In terms of agricultural income, however, it is not necessary that small-scale farmers are losing profits compared to larger land-size farmers. Farmers in Table 7 are producing rice as their main agricultural crop. Farmers with less than ten hectares are making profits in 2015 8% more than in 2010. On the other hand, farmers who are producing between 10 and 20 hectares are losing most of their profits in 2015 compared to 2010. Farmers with 20 and 50 hectares have fewer profits in 2015 than in 2010. Finally, farmers who are producing more than 50 hectares are making profits again. Those who are small-scale farmers with less than 10 hectares could be making profits through product differentiation such as environmentally friendly farming or branding. Farmers who are producing between ten and twenty hectares do not make profits even with subsidies.
Thus, facing with the situation that farmers with 10 to 20 hectares who might leave farming in the near future, both farmers and corporations that acquire such lands are necessary. In 2014, an agricultural land bank was created (Hirasawa, 2014). If matching goes well, farmers or corporations will increase their production acreages and increase efficiency. If it does not, then the abandoned acreages could increase.
Table 7. Changes in agricultural gross income and agricultural income by management size of entity (1,000 yen)
Note: Figures are from the 2010 and 2015 Census of Agriculture and Forestry
CONCLUSION
The state's long-term rice production adjustment policy ‘gentan’ was abolished from rice harvested in 2018. The purpose of the abolishment is to increase competitiveness of rice in Japan. For promotion of competitiveness, product differentiation should be necessary in terms of production locations, varieties and purpose types. Also, competitiveness could be promoted with further efficiency through land accumulation. We reviewed the current status of competitiveness of rice for domestic market from aspects of the change of rice price through its product differentiation and from aspects of management entity and rice production land areas.
The issue of excessive stock does not apply uniformly on a nationwide basis. Product differentiation within rice has been happening through production locations, varieties and purpose types. In terms of household use and food industry use, product differentiation was evident from the price difference until 2016. However, since the announcement of the abolishment of rice production acreage reduction system, the government also promoted direct payment support for feed rice. Although this has also a good intention to make domestic animal husbandry with provision of domestic feed, this has subsequently influenced the relative prices of household use and food industry use rice. In 2017, we no longer see any price difference between two human consumption rice. In particular, rice shortage of food industry rice is pushing up its price. What is happening should be those who are producing household use rice shift their production to food industry rice. However, this volatility of human consumption rice may shift farmers to produce feed rice which is stable with subsidies, even further.
Also, for promotion of production efficiency, changes over the number of other management entity, so called Qualified Land Owned Corporation (formally known as Farming Cooperative), is increasing and the total land area per farmer or other management entity has been confirmed. At the same time, however, we have observed not necessarily all farmers or other entities are benefiting from enlarging their land areas. Land areas between 10 and 20 hectares have not captured the opportunity to increase their agricultural income from 2010 to 2015. Unless they become profitable farmers, they will likely leave from the market in the near future. At that time, unless matching of land lease goes well, further abandoned land could increase.
More than 1,000 joint-stock companies have leased agricultural land through Agricultural Land Bank scheme, but matching is necessary for 10 to 20 hectares of land sized farms that are not making agriculture income and likely to leave the market in the near future.
Finally, supporting a maturing infant industry, rice feed market, in this context is necessary as it is just emerging market to grow. However, gradual reduction of the amount of direct payment which still applies to ‘rice’ farmers in Japan is necessary for promoting competitiveness which is the aim of the abolishment of ‘gentan’. Creating higher yield food industry rice or reduction of the amount of direct payment on feed rice should be necessary in order for food rice to have higher agricultural income relative to that of feed rice. Otherwise, we continued to face shortage of food industry rice and lose competitiveness of household use rice. If they keep ‘protecting’ rice farmers from competition in the market, subsidies on feed rice should be eventually faded away or competitiveness of human consumption rice may be lost. Whether rice could be oversupplied with the abolishment of acreage reduction system depends on the timing of the end of the ‘gentan’ second pillar, i.e. subsidies.
REFERENCES
MAFF, "2005 Census of Agriculture and Forestry"
MAFF, "2010 Census of Agriculture and Forestry"
MAFF, "2015 Census of Agriculture and Forestry"
MAFF, Annual data, the Management Improvement Bureau, MAFF
MAFF, Annual data, the Crop Production Policy Planning Division, Crop Production Bureau, MAFF
Ishii, R. (2018) ‘Nogyo no Seicho Sangyo ka heno hanten no shinario- Shiga ken wo ke-su ni’ (the scenario to make agriculture as growing industry – case of Shiga prefecture), Spring / Feb. 2018 / No.415
Fukuda, S. (2015) Ine SGS no Niku Yo Gyu Hanshoku Keiei deno riryo jittaito fukyu kakudai jyoken (Conditions for extension of and the current usage status of rice Soft Grain Silage (SGS) under beef cow breeding farm management), Chikusan no Jyoho, Livestock industries information, (311), 35-41.
Date submitted: July 30, 2018
Reviewed, edited and uploaded: Oct. 19, 2018
1 We converted JPY 112 to USD 1 (the currency exchange as of 2018/10/14
2 WCS of rice is used as forage for dairy cows. Whole crop rice was harvested 120 days after planting and chopped to 2-3-cm length for silage making.