ABSTRACT
Rice is an important component of the agri-value chain, and a life-line for the livelihood of billion rural Indians. India’s rice sector has been transformed significantly with the increase of rice production by 250% and yield by 230% between 1971 and 2015. There is a wide variation in the growth of the rice sector across ecosystems as well as states. India became a leading rice exporter in the world with the worth of US $ 9 Billion-an increase in export of basmati rice by four times and non-basmati rice by 3 folds in 2015 over 2005.
About 80 to 85% of rice farmers are small and marginal. Nearly 75% of India’s rice production is marketable surplus-largely generated by irrigated rice farmers in the north and south Indian states as well as large farmers in other parts of the country. The marketing system for rice has huge network that purchase paddy from farmers. Nearly 85-90% of the total rice production is domestically consumed in the form of cooked and steamed rice. Thus, rice value chain is largely confined to drying at farmers’ level, and milling and bagging at millers and traders’ level. Total value of rice value chain in India is estimated at only US $ 71 Billion, which is only 7.4% of the gross agri-value chain. In case of basmati rice, value chain has been developed considerably during the past decade. However, there is a huge potential to promote rice based products through modern value chain in view of rising demand for processed and packaged foods, driven by rapid urbanization, feminization, diet diversification and increase in incomes of middle class consumers in urban areas. Thus, promotion of rice value addition on large scale will generate huge employment opportunities for youth besides increasing farmers’ income.
Key words: Rice, India, value chain, marketing
INTRODUCTION
Rice is a life-line for food and nutritional security of a majority of 1.30 billion Indians. It is also a vital source of livelihood, directly or indirectly, for a majority of the 0.86 billion rural Indians. In particular, rice is the principal crop and the staple grain in the eastern, north-eastern and the southern states of India, and it is an important commercial crop in the north-western states of Punjab and Haryana where wheat is the staple grain. Rice farming is still considered as subsistence activity in about 60% of India’s rice area, dominated by rainfed ecosystem (eastern, north-eastern, and central regions). About half of the small and marginal farmers of eastern and north-eastern states produce rice mainly for their household consumption with little marketable surplus. However at national level, nearly 75% of rice production is considered marketable surplus, largely generated in the north and southern regions as well as by large farmers in other parts of the country (Government of India, 2016). Increasing productivity and profitability of the whole rice value chain is always a priority in India’s development policy in order to improve rural livelihood, ensure an adequate supply of rice at affordable prices, and earn foreign currencies from rice exports.
India’s paddy rice production increased from 63 to 158 million tons between 1970 and 2015–an increase of over 150%. Yield improvement contributed 84% to this increase while area expansion contributed only 16% (Janaiah and Faming, 2010). The rice production and productivity increased tremendously since the early 1970s, after the introduction of genetically improved high yielding varieties (HYV) during the mid-1960s. The widespread adoption of high-yielding varieties (HYVs) as well as crop and farm management practices; policy support to improve irrigation facilities, market infrastructure, and the supply of chemical fertilizers and agricultural credit; subsidies on farm inputs; and farmers’ enthusiasm to adopt HYVs were the major drivers of the impressive growth in production and productivity of rice in India (Janaiah et al. 2005; 2006). Within rice, the biggest success has been in the improvement of total factor productivity, the development and adoption of climate-smart varieties, vertical integration of value chain actors, and transformation of the basmati rice industry. As a result, India became one of the leading rice exporters in the world market today.
Although the Indian agriculture sector achieved astounding success over the past four decades, agri-value chain and agribusiness in India is yet to be transformed from primary stage to a modern industry level. Agri-processing and value addition is expanding recently in high-value food items such as fruits, vegetables, fish, etc. India’s rice sector has a huge potential to generate high value products through modern value chain in view of its large size in terms of area and production. Further rapid urbanization, industrialization, feminization, and diet diversification towards high value processed foods due to increase in income levels are creating substantial consumer demand for value-added rice products.
In this context, this paper attempts to discuss with empirical evidences in four parts, (a) an overview of performance of rice sector, (b)brief description on nature rice farming, (c) marketing channels and value chain, and (d) conclusion.
RICE SECTOR PERFORANCE
Rice accounts for 35% of the total cropped area and 42% of the total production of foodgrains in India (Table 1). Between 1971-73 and 2013-15, rice’s share in the total foodgrains slightly increased in area but remained virtually same in production. The national aggregate values, however, disguise a large variation in production environments across Indian states and regions. The data show that the contribution of rice to total foodgrains production varies enormously across regions and states (provinces) of the country depending on the agroecological conditions. In the humid tropics of the northeast (e.g., Assam and West Bengal) and the coastal regions of the south (e.g., Kerala), rice accounts for over 90% of the total area and production of foodgrains. Rice is also the principal crop in the humid subtropics of southern Bihar, Odisha and eastern Madhya Pradesh (MP), and in the sub-humid subtropics of northern Bihar and eastern Uttar Pradesh (UP). In these regions, farmers have little choice but to grow rice during the hot and humid monsoon season. The top three rice producing states are West Bengal, UP and AP (including Telangana), which together contribute 40% to India’s rice production (Table 1).
Table 1. The relative importance of rice in total foodgrains area and production, by state, India, 1971-73 and 2013-15.
| |
|
1971-73
|
2013-15
|
| |
|
Area
|
Prod.
|
Area
|
Prod.
|
|
Zone/State
|
(%)
|
(%)
|
(%)
|
(%)
|
|
East zone
|
|
|
|
|
| |
Assam
|
92
|
94
|
92
|
96
|
| |
Bihar
|
52
|
53
|
51
|
52
|
| |
Odisha
|
77
|
83
|
81
|
92
|
| |
W. Bengal
|
82
|
84
|
87
|
89
|
|
North zone
|
|
|
|
|
| |
M. Pradesh
|
27
|
32
|
29
|
28
|
| |
Maharastra
|
11
|
25
|
14
|
26
|
| |
U. Pradesh
|
23
|
21
|
30
|
30
|
|
West zone
|
|
|
|
|
| |
Gujarat
|
9
|
11
|
21
|
23
|
| |
Haryana
|
7
|
12
|
29
|
25
|
| |
Punjab
|
12
|
13
|
44
|
40
|
|
South zone
|
|
|
|
|
| |
A. Pradesh
|
35
|
65
|
56
|
66
|
| |
Karnataka
|
16
|
35
|
17
|
30
|
| |
Kerala
|
95
|
98
|
99
|
99
|
| |
Tamilnadu
|
53
|
77
|
51
|
62
|
|
All zones
|
|
|
|
|
| |
Others
|
8
|
17
|
10
|
14
|
|
|
India
|
31
|
41
|
35
|
41
|
Source: Data from Ministry of Agriculture, GOI (2017 and previous years).
Notes:
- Foodgrains include milled rice, wheat, maize, coarse grains, and pulses.
- Andhra Pradesh includes Telangana; Bihar includes Jharkhand; Madhya Pradesh includes Chattisgarh; and Uttar Pradesh includes Uttarakhand.
Paddy rice production at the national level increased from 63 to 160 million tons between 1971-73 and 2013-15—an increase of 2.3% per year (Fig. 1), which is higher than the growth rate of population during the same period. Yield improvement was the major contributor to this production growth. The yield growth contributed 84%, while the area growth contributed only 16% to this production growth (Fig. 2). The paddy rice yield increased from 1.7 to 3.6 t/ha over the last four decades. The higher growth rate of rice production than population led to substantial increase in per capita rice production. Per capita paddy rice production increased from 108 kg to 126 kg from the early 1970s to the late 1990s, despite 70% increase in the country’s population in the same period. It decreased in the early 2000s, but again stared rising since the late 2000s reaching 128 kg in 2013-15. The substantial increase in per capita rice production resulted in an adequate supply of rice at affordable prices, which was instrumental to improve national food security, reduce poverty, and uplift rural livelihoods.
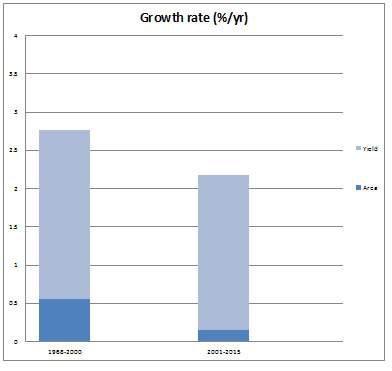
Fig. 1. Growth aate in area, production and yield during early and late green revolution periods in India
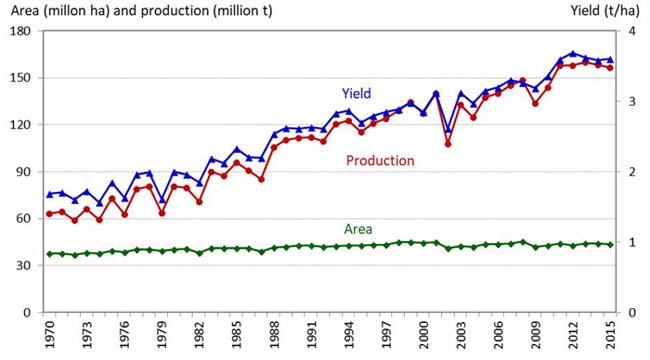
Fig. 2. Trends in rice (paddy) area, production, and yield in India, 1970-2015.
Source: Data from Ministry of Agriculture, GOI (2017 and previous years).
The national level aggregate values mask a large heterogeneity in rice area, yield, and production across the Indian states. Rice yield has increased significantly in all states over the past four decades, although the magnitudes of increase vary considerably. In the early 1970s, Paddy rice yield across states ranged from 1.1 to 3.2 t/ha (Fig. 2) during the early 1970s. The northern states of Punjab and Haryana and southern states of Andhra Pradesh (AP), Karnataka, Kerala and Tamil Nadu had relatively better irrigation infrastructure and quickly started adopting the green revolution technologies (Table 2). As a result, these states achieved a substantially high yield (over 2.0 t/ha) even in the early 1970s. After four decades in 2013-15, paddy rice yield across states ranged from 2.2 to 5.9 t/ha. Paddy yield is about 4.0 t/ha or above in West Bengal, Punjab, Haryana, and all major rice growing southern states. But the yield is still considerably lower in many other states, especially the eastern Indian states (Fig. 3).
Table 2. Input use intensification in rice farming, by state, India, 1970-2013.
| |
|
Rice irrigated area (%)
|
Rice area under high
yielding varieties (%)
|
Fertilizers use per hectare
of gross cropped area (NPK, Kg/ha)
|
|
Zone/State
|
1985-87
|
2012-14
|
1970-72
|
2008-10
|
1975-76
|
2013-14
|
|
East zone
|
|
|
|
|
|
|
| |
Assam
|
23
|
11
|
10
|
65
|
2
|
65
|
| |
Bihar
|
36
|
46
|
8
|
66
|
13
|
165
|
| |
Odisha
|
33
|
33
|
6
|
79
|
7
|
98
|
| |
W. Bengal
|
24
|
47
|
13
|
94
|
17
|
131
|
|
North zone
|
|
|
|
|
|
|
| |
M. Pradesh
|
20
|
34
|
9
|
45
|
5
|
84
|
| |
Maharastra
|
30
|
26
|
17
|
94
|
14
|
127
|
| |
U. Pradesh
|
37
|
85
|
19
|
79
|
21
|
149
|
|
West zone
|
|
|
|
|
|
|
| |
Gujarat
|
53
|
65
|
14
|
87
|
15
|
120
|
| |
Haryana
|
99
|
100
|
23
|
50
|
19
|
179
|
| |
Punjab
|
98
|
100
|
63
|
99
|
52
|
217
|
|
South zone
|
|
|
|
|
|
|
| |
A. Pradesh
|
95
|
97
|
26
|
98
|
31
|
227
|
| |
Karnataka
|
59
|
74
|
16
|
87
|
20
|
136
|
| |
Kerala
|
43
|
76
|
31
|
91
|
22
|
121
|
| |
Tamil Nadu
|
90
|
93
|
77
|
87
|
39
|
154
|
|
All zones
|
|
|
|
|
|
|
| |
Others
|
45
|
55
|
21
|
54
|
9
|
85
|
|
|
India
|
44
|
60
|
19
|
79
|
17
|
131
|
Source: Data from Ministry of Agriculture, GOI (2017 and previous years).
Notes: Andhra Pradesh includes Telangana, Bihar includes Jharkhand, M. Pradesh includes Chattisgarh, and U. Pradesh includes Uttarakhand.
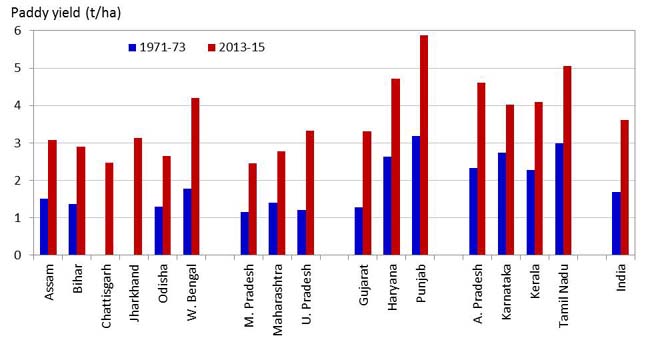
Fig. 3. Trends in paddy rice yield in major rice growing states, India, 1971-73 and 2013-15.
Source: Data from Ministry of Agriculture, GOI (2017 and previous years) (2015).
During the first decade of GR (i.e. 1960s), rice production growth was limited to regions with already developed irrigation infrastructure, such as AP, Haryana, Karnataka, Kerala, Punjab, and Tamil Nadu, where farmers quickly adopted HYV suitable for the irrigated ecosystem (Janaiah et al., 2006). In the early 1970s, rice yield had been already high, exceeding 2.3 t/ha in these states (Fig. 3). In Punjab and Haryana, both rice area and yield increased spectacularly that led to a production increase of 250% in Punjab and 180% in Haryana from the early 1960s to the early 1970s. In the traditional rice bowls of eastern India, the diffusion of new technologies started only in the 1980s with (a) the expansion of small-scale groundwater irrigation that allowed farmers to grow HYVs during the dry season (boro rice) and manage monsoon failures during the wet season with supplementary irrigation, (b) the availability of intermediate height HYVs that are suitable for the shallow and medium flooded, poorly drained land that constitute an important sub-ecosystem in these states. As HYVs started spreading in eastern India, the regional aggregate rice yield growth rate jumped from virtually 0 to 4.1% per year and rice production growth rate jumped from 0.1 to 4.7% per year from the 1970s to the 1980s. Across states in eastern India, the rice yield growth rate was negative in all states except West Bengal in the 1970s, but rice yield picked up and maintained in the order of 0.6 to 5.5% per year in the 1980s (Table 3).
Table 3. The decadal growth rate of area, yield, and production of rice, by state, India, 1970-2015 (% per year).
| |
|
1970-79
|
1980-89
|
1990-99
|
2000-15
|
|
Zone/State
|
A
|
Y
|
P
|
A
|
Y
|
P
|
A
|
Y
|
P
|
A
|
Y
|
P
|
|
East zone
|
|
|
|
|
|
|
|
|
|
|
|
|
| |
Assam
|
1.5
|
-0.9
|
0.6
|
0.5
|
0.6
|
1.1
|
0.1
|
1.0
|
1.1
|
-0.1
|
2.7
|
2.6
|
| |
Bihar
|
0.5
|
-0.2
|
0.3
|
0.3
|
3.8
|
4.1
|
0.1
|
4.3
|
4.4
|
4.1
|
6.6
|
10.7
|
| |
Odisha
|
-0.9
|
-0.5
|
-1.4
|
0.4
|
3.5
|
3.9
|
0.2
|
-1.5
|
-1.3
|
-0.7
|
2.9
|
2.2
|
| |
W. Bengal
|
-0.1
|
0.8
|
0.8
|
1.1
|
5.5
|
6.6
|
0.5
|
1.9
|
2.5
|
-0.6
|
1.1
|
0.5
|
|
North zone
|
|
|
|
|
|
|
|
|
|
|
|
|
| |
M. Pradesh
|
0.9
|
-4.0
|
-3.1
|
0.4
|
1.7
|
2.0
|
0.7
|
-0.9
|
-0.1
|
0.4
|
5.0
|
5.4
|
| |
Maharastra
|
1.7
|
5.0
|
6.7
|
-0.1
|
-0.6
|
-0.7
|
-0.7
|
2.1
|
1.4
|
0.1
|
1.9
|
2.0
|
| |
U. Pradesh
|
1.3
|
0.3
|
1.6
|
0.0
|
5.5
|
5.5
|
0.9
|
2.2
|
3.1
|
0.1
|
1.2
|
1.3
|
|
West zone
|
|
|
|
|
|
|
|
|
|
|
|
|
| |
Gujarat
|
0.3
|
3.8
|
4.1
|
0.4
|
-0.6
|
-0.2
|
2.0
|
1.7
|
3.7
|
2.1
|
4.3
|
6.4
|
| |
Haryana
|
6.4
|
4.3
|
10.7
|
2.4
|
-0.1
|
2.2
|
5.9
|
-1.7
|
4.3
|
2.1
|
1.1
|
3.2
|
| |
Punjab
|
11.7
|
5.2
|
17.0
|
5.3
|
1.3
|
6.5
|
2.5
|
0.0
|
2.5
|
1.0
|
0.7
|
1.7
|
|
South zone
|
|
|
|
|
|
|
|
|
|
|
|
|
| |
A. Pradesh
|
1.9
|
2.2
|
4.1
|
0.5
|
1.9
|
2.5
|
0.5
|
1.1
|
1.7
|
0.7
|
0.6
|
1.3
|
| |
Karnataka
|
-0.1
|
1.5
|
1.4
|
0.4
|
-0.1
|
0.2
|
1.7
|
1.9
|
3.6
|
-0.2
|
0.8
|
0.6
|
| |
Kerala
|
-1.1
|
0.6
|
-0.5
|
-4.2
|
1.2
|
-3.0
|
-5.7
|
0.7
|
-5.1
|
-4.0
|
1.9
|
-2.1
|
| |
Tamil Nadu
|
0.2
|
0.2
|
0.5
|
-2.0
|
5.8
|
3.8
|
1.1
|
0.6
|
1.7
|
-0.1
|
1.2
|
1.1
|
|
All zones
|
|
|
|
|
|
|
|
|
|
|
|
|
| |
Others
|
2.0
|
1.5
|
3.5
|
-0.1
|
0.8
|
0.7
|
0.5
|
0.7
|
1.2
|
0.7
|
1.6
|
2.3
|
|
|
India
|
0.9
|
1.0
|
1.9
|
0.4
|
3.1
|
3.6
|
0.7
|
1.3
|
2.0
|
0.0
|
1.8
|
1.8
|
Source: Data from Ministry of Agriculture, GOI (2017 and previous years).
Notes: - Abbreviations: A-area, Y-yield, and P-production.
- Andhra PradeshBihar includes Jharkhand, M. Pradesh includes Chattisgarh, and U. Pradesh includes Uttarakhand.
The additional rice production over the past four decades came mostly from the non-traditional rice growing states and the irrigated ecosystem in the traditional belt. During 1970‒2013, India’s paddy area increased by 6.1 million ha and paddy yield increased by 2.0 t/ha, which together lead to a production increase of 95.4 million tons (Table 4). The share of different states to the national rice production changed considerably during that period. It decreased from 40 to 35% in the eastern zone, increased from 20 to 26% in the northern zone, increased from 4 to 16% in the western zone, and decreased from 33 to 21% in the southern zone. Of the incremental rice production over the past four decades, the eastern states contributed 31%, the northern states contributed 30%, the western states contributed 23%, and the southern states contributed 14%. Punjab’s share in the national rice production was only 2% in the early 1970s, but this increased to 10% in the early 2010s. Punjab contributed 16% to the incremental rice production over the past four decades (Table 4). Punjab benefitted the most from the green revolution in rice farming as it had developed reliable irrigation infrastructure and enterprising farmers with a relatively large size of farm holdings (Table 2).
Table 4. The relative importance of rice area and production, by state, India, 1971-73 and 2011-13.
| |
|
Rice area and production
|
|
Share of states to all India
|
| |
|
1971-73
|
|
2013-15
|
1971-73
|
|
2013-15
|
| |
|
A
|
P
|
|
A
|
P
|
A
|
P
|
|
A
|
P
|
|
Zone/State
|
(Mha)
|
(Mt)
|
|
(Mha)
|
(Mt)
|
(%)
|
(%)
|
|
(%)
|
(%)
|
|
East zone
|
|
|
|
|
|
|
|
|
|
|
| |
Assam
|
2.0
|
3.1
|
|
2.5
|
7.6
|
5
|
5
|
|
6
|
5
|
| |
Bihar
|
5.1
|
6.9
|
|
4.7
|
13.9
|
14
|
11
|
|
11
|
9
|
| |
Odisha
|
4.6
|
6.0
|
|
4.1
|
10.9
|
12
|
10
|
|
9
|
7
|
| |
W. Bengal
|
5.1
|
9.0
|
|
5.5
|
23.0
|
14
|
14
|
|
12
|
15
|
|
North zone
|
|
|
|
|
|
|
|
|
|
|
| |
M. Pradesh
|
4.5
|
5.2
|
|
5.8
|
14.4
|
12
|
8
|
|
13
|
9
|
| |
Maharastra
|
1.3
|
1.9
|
|
1.6
|
4.3
|
4
|
3
|
|
4
|
3
|
| |
U. Pradesh
|
4.5
|
5.5
|
|
6.2
|
31.1
|
12
|
9
|
|
14
|
20
|
|
West zone
|
|
|
|
|
|
|
|
|
|
|
| |
Gujarat
|
0.4
|
0.6
|
|
0.8
|
2.6
|
1
|
1
|
|
2
|
2
|
| |
Haryana
|
0.3
|
0.8
|
|
1.3
|
6.1
|
1
|
1
|
|
3
|
4
|
| |
Punjab
|
0.5
|
1.5
|
|
2.9
|
17.1
|
1
|
2
|
|
7
|
11
|
|
South zone
|
|
|
|
|
|
|
|
|
|
|
| |
A. Pradesh
|
3.1
|
7.3
|
|
3.8
|
17.5
|
8
|
12
|
|
9
|
11
|
| |
Karnataka
|
1.1
|
3.0
|
|
1.3
|
5.1
|
3
|
5
|
|
3
|
3
|
| |
Kerala
|
0.9
|
2.0
|
|
0.2
|
0.8
|
2
|
3
|
|
0
|
1
|
| |
Tamil Nadu
|
2.7
|
8.2
|
|
1.8
|
9.3
|
7
|
13
|
|
4
|
6
|
|
All zones
|
|
|
|
|
|
|
|
|
|
|
| |
Others
|
1.3
|
2.3
|
|
1.6
|
5.2
|
3
|
4
|
|
4
|
3
|
|
|
India
|
37.6
|
63.2
|
|
43.9
|
158.3
|
100
|
100
|
|
100
|
100
|
Source: Data from Ministry of Agriculture, GOI (2017 and previous years).
Notes:
- Rice production value refers to rice quantity measured in paddy form.
- Abbreviations: A—area, P—production, Mha—million hectares, and Mt—million tons.
- A. Pradesh includes Telangana, Bihar includes Jharkhand, M. Pradesh includes Chattisgarh, and U. Pradesh includes Uttarakhand.
-
Rice exports
India is a traditional exporter of a special quality rice, basmati to the Middle East, Europe and USA. However with the substantial increases in production of rice-both basmati and non-basmati rice- after mid-1990s, India became a leading rice exporter in the world during the recent past. At present, rice accounts for about 20% of total India’s agriculture exports in terms of value. India is mainly exporting rice into two categories such as basmati rice and non-basmati rice. Sella Rice, Steamed Rice, and Pusa Rice are the different types of rice that are exported under basmati rice category. While Parboiled Rice, Broken Rice, Sella Rice, Swarna Rice and Sona Masoori Rice are the types that are exported under non-basmati Rice category. The export of basmati rice has significantly increased from about one million tonnes to abot 4 million tonnes during the past ten years (Table 5). Similar quantum jump was registered in the export of non-basmati rice by 2.5 to 3 times increase during the same period. Total rice export from India during 2014-15 was all-time record, i.e. about 12 million metric tons, which is about 30% of global rice exports. The total value of rice exports during 2014-15 was approximately US 9 Billion, of which the share of basmati rice was about 56%. In 2015-16 and 2016-17, basmati rice exports have increased by about 10% over previous years, but non-basmati rice exports have declined after 2014-15 (Table 5). The Indian basmati rice and non-basmati rices have fetched price of US $ 1010 and 413 per metric tons respectively in the world rice market during 2016-17.
Table 5. Rice exports from India during 2004 - 05 to 2014 -15
(Quantity in million metric tonnes)
|
Year
|
Basmati
|
Non-Basmati
|
Total
|
|
2004-2005
|
1.163
|
3.615
|
4.778
|
|
2005-2006
|
1.167
|
2.922
|
4.089
|
|
2006-2007
|
1.046
|
3.702
|
4.748
|
|
2007-2008
|
1.183
|
5.286
|
6.469
|
|
2008-2009
|
1.556
|
0.932
|
2.488
|
|
2009-2010
|
1.217
|
0.140
|
1.357
|
|
2010-2011
|
2.371
|
0.101
|
2.472
|
|
2011-2012
|
3.178
|
3.998
|
7.176
|
|
2012-2013
|
3.460
|
6.688
|
10.148
|
|
2013-2014
|
3.757
|
7.019
|
10.776
|
|
2014-2015
|
3.702
|
8.274
|
11.976
|
|
2015-2016
|
4.047
|
6.373
|
10.420
|
|
2016-2017
|
4.104
|
6.815
|
10.915
|
Source: Government of India ( 2010, 2018)
Up until the early 1990s, Pakistan dominated the world basmati rice market, but significant increases in production due to improved technologies and farm management practices, upgrading of postharvest systems (drying, storage, milling, and processing), improved value addition (packaging and branding), and wider marketing brought success to the Indian basmati industry and has made India the leader in the world basmati rice market today. Favorable trade policy and licensing procedures for agricultural exports, private-sector efforts to promote rice exports, and the zeal of basmati rice exporters to establish themselves as reliable suppliers contributed to the success of the Indian basmati industry. Like-wise, surplus production of high-quality non-basmati rice varieties such as Samba Masuri and Jyothi made India to increase overall rice exports during the past one decade. However, there has been a wide fluctuations in the export quantity of non-basmati rice over the period (Table 5) due to fluctuations in domestic supply, and uncertain government trade policy on foodgrains exports.
NATURE OF RICE FARMING
Rice is widely grown by nearly 120 million farmers in total cropped area of 43 million hectares. About 80-85% of rice farmers are small and marginal whose average farm size is less than one hectare. Rice farming for these small and marginal farmers is subsistence in nature in rainfed areas who produce rice mainly for domestic consumption with little marketable surplus. However rice is emerged as a commercial crop under irrigated areas of north and south Indian where farmers produce paddy mainly for market. In India, about 85 to 90% of total rice production is consumed domestically.
Rice is cultivated under diverse production environments i.e. irrigated ecosystem, rainfed ecosystem and deep-water condition , which accounts for 56%, 38% and 6% of rice land area in India. Rice is mainly grown in wet season (June to Nov) accounting for about 70% of rice area while dry season (Dec -April) occupies remaining 30% where assured irrigation is available. . Farmers harvest about 5 to 5.5 tons/ha of paddy yields during wet season under irrigated ecosyem. In dry season under irrigated condition, paddy yield is about 20-25% higher than in wet season. Under rainfed and deep-water conditions, farmers get average paddy yield of only 3 to 4.5 tons/ha.
Farmers follow transplantation method of crop establishment mainly under irrigated ecosystem, where farmers use 20-25 days old seedlings from paddy nursery for transplantation. In general, farmers follow zig-zag method of transplantation (not line row method). Broadcasting of three to four days old sprouted paddy seeds is a common method under rainfed upland areas where paddy yields are low. Farmers use 100 to 120 kg of nitrogen, 40-60 kg of phosperous and 40 to 50 kg of potassium per hectare in three to four splits in different form. The use of organic manures and fertifizers has declined over the period due to substantial reduction in livestock population in rural India. Nearly 85 to 90% of India’s rice is now covered with high yielding varieties (HYVs). Hybrid rice coverage in the farmers’ fields is very meagre, i.e. less than 3% of total rice area. In India, total of about 1200 HYVs and hybrids were developed and released by various R&D institutions over the past five decades. However, the 30 most popular HYVs covered in 75% of rice area in India (Janaiah and Hossain, 2005). On an average, farmers replace paddy seeds with newly purchased certified seeds once in three to four years; i.e. seed replacement rate is about 25 to 33% in India (Janaiah and Debdutta, 2016). Paddy farmers adopt integrated pest and disease management practices against major insect pests such as stem borer, brown plant hopper, leaf folder, gall midge, etc and major diseases such as blast, bacterial leaf blight, sheath blight, tungro, etc. Rice farming in India including under rainfed areas is largely mechanized as farmers use modern machinery for ploughing and puddling (tractors, power tillers), irrigation (pump-sets), transplantation (transplanters only in some areas), and harvesting, threshing and winnowing (mini and combine harvesters and threshers). In many rice areas, farmers follow chemical weeding. Increasing labour shortage for farming and decreasing livestock in rural India are two key reasons for increased mechanisation and chemicalization of rice farming in India. At present, cost of producing one metric tonne of paddy rice under irrigated input intensive areas is about US $ 200 to 250, while it is about 150 to 180 in rainfed regions.
MARKETING CHANNELS AND VALUE CHAIN
An efficient marketing with value chain is crucial for transforming the rice sector into an industry mode. Rice farming is a subsistence activity for half of the small and small farmers under rainfed rice areas whose marketable surplus is small portion of their rice production. Large quantity of marketable surplus of rice is generated in the southern and north Indian states. At national level, 75% of paddy production is marketable surplus, largely generated in the irrigated regions of south and north Indian states as well as by large farmers in other parts of the country (Government of India, 2016). Most of the marketable paddy surplus is sold out by farmers in the form of paddy after drying and bagging. Small and marginal farmers sell their produce after retaining required quantity for their home consumption to local village traders at relatively lower price right at the threshing yard. Large and medium sized farmers whose marketable surplus is substantially more sell paddy to rice millers or supply formal public agencies at higher price. In either case including basmati rice farmers (except contract farmers of few big companies), paddy farmers sell only paddy after very little value addition except drying and bagging. About 90% of paddy marketable surplus is marketed through the various channels. There is a huge public sector manageing and marketing network in India with many agencies and institutions, which were set up in the 1960s and 70s. There are four forms of marketing channels through which paddy farmers sell their surplus paddy in India.
Public sector marketing agencies
The State Civil Supplies Corporation (SCSC) at state level and Food Corporation of India-FCI at the national level are two major public sector agencies that procure paddy rice through direct purchase centres mainly in surplus regions of the north-west and southern states. These agencies also procure rice (milled) through rice millers to maintain central buffer stocks. An important issue is that most of these agencies are old and not modernized in lines with demand. Nearly 25 to 30% of total marketable surplus of paddy rice is procured through these agencies. Farmers get paid government’s fixed minimum support price (MSP) for their produce from agencies. However the operation of these agencies is very limited or even absent in the eastern, north-eastern and some central Indian states.
Regulated Markets (Agril. Market Committees):
There are about 8000 regulated markets and 32,000 rural and wholesale markets with government-controlled committees are functioning in the country. These markets are managed by farmers’ representatives and financially self-sustained because; these markets collects 1% of farm produce values as a cess from purchasers, and use this income for market development. All transactions between farmers and licensed traders in these markets are monitored and regulated by respective State Department Officials in order to avoid malpractices and to facilitate fair trade through open auction method. All types of farmers especially medium and large farmers who were out of reach of FCI and SCSCs purchase centres bring their paddy to these markets for selling. Farmers may get competitive price in these markets as open auction method is followed by licensed traders to buy paddy from farmers. This price may less or more than MSP depends upon supply-demand situation on day to day basis. These markets purchase 30 to 35% of total marketable surplus of paddy in the country.
Women elf-elp roups
There are 12 million Women Self-Help Groups (WSHGs) in India, formed by village women themselves with the support of government and rural financial institutions over the past two decades. They are functioning as gross root level institutions especially for empowerment of rural women. Recently, these WSHGs are permitted in southern states to buy paddy directly from the farmers on behalf of State Civil Supplies Corporation, and millers for which Rs 1 per bag of 70 kg will be paid to WSHGs as a commission. About 3 to 4 million tons of paddy procured by WSHGs mainly in south Indian states.
Open Market (Village traders)
In addition to above channels, a large numbers of traders are buying farm produce from farmers and sell it to the millers. Most of these traders are village level business people, money lenders, etc who often lend loans to the small and marginal farmers with a condition that farmers sell their produce to these traders. Most of small farmers usually sell their produce to the village traders, which accounts for 30 to 35% of total marketed surplus. Generally, farmers get paid relatively lower price by the local traders.
Value addition
The value addition in rice sector is largely confined to drying and bagging of paddy at the farmers’ level, milling, cleaning and separation at millers’ point, and bagging with different sizes of quantity at wholesale point. In case of exportable basmati rice, some registered companies have contracts with farmers and provide required technical advises and quality seeds to farmers to produce quality basmati rice. These companies involved in grading, cleaning, packing and branding in order to meet requirements of global rice markets. There are about 100 different registered companies engage in rice trading of in India-both for export and domestic markets. These companies also started grading, packing and branding of quality non-basmati rice for providing to the high income consumers through different super markets and big retailers. Unlike earlier, rice in small packages of various sizes, varying from one to 25 kg are now available with brand names in some big retailing malls in urban areas. But the share of packaged and branded rice in the total rice sales to consumers is meagre, i.e. less than 10%. However demand for branded and packaged rice is increasing in urban India. Historically, the Indian consumers eat rice in the form of cooked and steamed rice. Rice-based processing industry is very small in India, and confined to only few rice based products for occasional consumption.
At present, only 5 to 6% of total farm output is passing through modern value chain and processing in India. Thus, the gross value of agri-value chain (both inputs and outputs is estimated at only US$ 960 Billion, although the value of raw farm output is about US$ 400 Billion. Rice is an important component of agri-value chain in India. The value of paddy rice accounts for about 8% of total value of raw agriculture output in India. Nearly 85-90% of rice production is consumed domestically, largely in the form of cooked/steamed rice. Therefore the share of rice-based products in the dietary system is negligible, however it is increasing in recent years. Thus, the gross value of rice value chain is only about US$ 71 Billion, of which share of value addition is only 28% (wholesale and retail traders’ share), and -54% is for farmers’ share (farm-gate price) and by-product value is 18%. The share of rice value chain in the India’s agri-value chain is only 7.4%.
The opportunities for promotion of modern value chain rice are plenty in view of growing consumer demand for processed and value added rice products. Some key challenges that confront the expansion of the rice value chain are (a) small farm size of rice farmers, (b) inadequate institutional and infrastructure, (c) lack of modern milling and processing methods, (d) low yields, (e) weak quality regulation, and (f) traditional food habits of rice consumers-preferences.
CONCLUSION
Rice is a life line for India’s food and nutritional security, and source of the rural livelihood for half billion people. With the introduction of green revolution led high yielding varieties coupled with input uses and government’s policy support, rice production has increased by 250% and yield by 230% between 1971 and 2015. The irrigated regions of north and south Indian performed better in rice sector during the 1970 and 80s while the rainfed areas in eastern, north-eastern and central Indian states have picked up to increase rice yields after mid 1980s. As a result, about 10 to 12 million tonnes of exportable surplus-both basmati (4 million tons) and non-basmati (8 million tons) rice- was generated after meeting domestic consumption requirements. India became leading rice exporter in the world today worth of US $ 9 Billion-an increase in export of basmati rice by four time and non-basmati rice by 3 folds in 2015 over 2005.
Rice is grown by about 120 million farmers under diverse ecosystems across India, of which 80 to 85% are small and marginal. Farmers follow different methods of crop establishment with improved seeds of HYVs and other inputs, varying from one ecosystem to other. Nearly 75% of India’s rice production is marketable surplus-largely generated by irrigated rice farmers in north and south Indian states as well as large farmers in other parts of the country. The marketing system for rice has huge network-both under public and private sector-that purchase paddy from farmers. Nearly 85-90% of total rice production is domestically consumed in the form of cooked and steamed rice. Thus, rice value chain is largely confined to drying at farmers’ level, and milling and bagging at millers and traders’ level. Total value of rice value chain in India is estimated at only US $ 71 Billion (58% of it is raw paddy value), which is only 7.4% of gross agri-value chain. In case of basmati rice, registered companies provide considerable services to contracted farmers for maintain quality of produce through various value addition activities. However, there is a huge potential to promote rice based products through modern value chain in view of rising demand for processed and packaged foods, driven by rapid urbanisation, feminisation, diet diversification and increase in incomes of middle class consumers in urban areas. Rice farmers’ income cannot be increased in future without promotion of value addition and rice based processing. At present, farmers’ get market price of only US $ 200 to 250 per ton of raw paddy without any value addition. If C-3 category cost of production is considered (includes all operational costs, imputed value of own family labour and rental value of land, interest on fixed capital and depreciation on farm equipments), farm-gate price of paddy is nearly same as C3 costs (Government of India, 2017). Further, promotion of rice value addition on large scale will generate huge employment opportunities for youth besides increasing farmers’ income. The key challenges constraining rice value chain are traditional food habits, lack of modern infrastructure, presence of large number of small and marginal farmers in rice sector, etc.
REFERENCES
Government of India (2017), Price policy for Kharif crops-2017, Commission for Agriculture Costs and Prices, Ministry of Agriculture and Farmers’ Welfare, Government of India, New Delhi.
Government of India (2017), Agriculture statistics at a glance-2016-17, Directorate of Economics and Statistics, Ministry of Agriculture and Farmers’ Welfare, Government of India, New Delhi.
Government of India (2010, 2018), Commodity Profile: Rice -2010 and 2018, Directorate of Economics and Statistics, Ministry of Agriculture and Farmers’ Welfare, Government of India, New Delhi.
Janaiah, Aldas and Debdatta, B (2017), Rice Seed System in India: Institutional and Policy Issues” In The Future of Rice Strategy for India” (edited by Samarendu Mohanty, and others),Elsvier Publishers, UK
Janaiah, A., Hossain, M., Otsuka, K. 2006. Productivity impact of the modern varieties of rice in India. The Developing Economies, 44(2):190-207.
Janaiah, Aldas, Keijiro Otsuka and Mahabub Hossain (2005). Is the Productivity Impact of the Green Revolution in Rice Vanishing? Empirical Evidence from TFP Analysis for Rice. Economic and Political Weekly, Vol. 40 (53), Pp. 5596-5600
Janaiah, Aldas and Mahabub Hossain (2004). Partnership in the Public Sector Agricultural R & D: Evidence from India. Economic and Political Weekly, Vol. 39 (50), pp. 5327-5334
Jha, D., Kumar, P. 1996. Rice production and impact of rice research in India. Paper presented at the International Conference on the Impact of Rice Research. Bangkok, Thailand, 3-5 June 1996.
| (Submitted as a paper for the International Seminar on “Promoting Rice Farmers’ Market through value-adding Activities”, June 6-7, 2018, Kasetsart University, Thailand) |

Performance of Rice Industry in India: Potential Opportunities and Challenges
ABSTRACT
Rice is an important component of the agri-value chain, and a life-line for the livelihood of billion rural Indians. India’s rice sector has been transformed significantly with the increase of rice production by 250% and yield by 230% between 1971 and 2015. There is a wide variation in the growth of the rice sector across ecosystems as well as states. India became a leading rice exporter in the world with the worth of US $ 9 Billion-an increase in export of basmati rice by four times and non-basmati rice by 3 folds in 2015 over 2005.
About 80 to 85% of rice farmers are small and marginal. Nearly 75% of India’s rice production is marketable surplus-largely generated by irrigated rice farmers in the north and south Indian states as well as large farmers in other parts of the country. The marketing system for rice has huge network that purchase paddy from farmers. Nearly 85-90% of the total rice production is domestically consumed in the form of cooked and steamed rice. Thus, rice value chain is largely confined to drying at farmers’ level, and milling and bagging at millers and traders’ level. Total value of rice value chain in India is estimated at only US $ 71 Billion, which is only 7.4% of the gross agri-value chain. In case of basmati rice, value chain has been developed considerably during the past decade. However, there is a huge potential to promote rice based products through modern value chain in view of rising demand for processed and packaged foods, driven by rapid urbanization, feminization, diet diversification and increase in incomes of middle class consumers in urban areas. Thus, promotion of rice value addition on large scale will generate huge employment opportunities for youth besides increasing farmers’ income.
Key words: Rice, India, value chain, marketing
INTRODUCTION
Rice is a life-line for food and nutritional security of a majority of 1.30 billion Indians. It is also a vital source of livelihood, directly or indirectly, for a majority of the 0.86 billion rural Indians. In particular, rice is the principal crop and the staple grain in the eastern, north-eastern and the southern states of India, and it is an important commercial crop in the north-western states of Punjab and Haryana where wheat is the staple grain. Rice farming is still considered as subsistence activity in about 60% of India’s rice area, dominated by rainfed ecosystem (eastern, north-eastern, and central regions). About half of the small and marginal farmers of eastern and north-eastern states produce rice mainly for their household consumption with little marketable surplus. However at national level, nearly 75% of rice production is considered marketable surplus, largely generated in the north and southern regions as well as by large farmers in other parts of the country (Government of India, 2016). Increasing productivity and profitability of the whole rice value chain is always a priority in India’s development policy in order to improve rural livelihood, ensure an adequate supply of rice at affordable prices, and earn foreign currencies from rice exports.
India’s paddy rice production increased from 63 to 158 million tons between 1970 and 2015–an increase of over 150%. Yield improvement contributed 84% to this increase while area expansion contributed only 16% (Janaiah and Faming, 2010). The rice production and productivity increased tremendously since the early 1970s, after the introduction of genetically improved high yielding varieties (HYV) during the mid-1960s. The widespread adoption of high-yielding varieties (HYVs) as well as crop and farm management practices; policy support to improve irrigation facilities, market infrastructure, and the supply of chemical fertilizers and agricultural credit; subsidies on farm inputs; and farmers’ enthusiasm to adopt HYVs were the major drivers of the impressive growth in production and productivity of rice in India (Janaiah et al. 2005; 2006). Within rice, the biggest success has been in the improvement of total factor productivity, the development and adoption of climate-smart varieties, vertical integration of value chain actors, and transformation of the basmati rice industry. As a result, India became one of the leading rice exporters in the world market today.
Although the Indian agriculture sector achieved astounding success over the past four decades, agri-value chain and agribusiness in India is yet to be transformed from primary stage to a modern industry level. Agri-processing and value addition is expanding recently in high-value food items such as fruits, vegetables, fish, etc. India’s rice sector has a huge potential to generate high value products through modern value chain in view of its large size in terms of area and production. Further rapid urbanization, industrialization, feminization, and diet diversification towards high value processed foods due to increase in income levels are creating substantial consumer demand for value-added rice products.
In this context, this paper attempts to discuss with empirical evidences in four parts, (a) an overview of performance of rice sector, (b)brief description on nature rice farming, (c) marketing channels and value chain, and (d) conclusion.
RICE SECTOR PERFORANCE
Rice accounts for 35% of the total cropped area and 42% of the total production of foodgrains in India (Table 1). Between 1971-73 and 2013-15, rice’s share in the total foodgrains slightly increased in area but remained virtually same in production. The national aggregate values, however, disguise a large variation in production environments across Indian states and regions. The data show that the contribution of rice to total foodgrains production varies enormously across regions and states (provinces) of the country depending on the agroecological conditions. In the humid tropics of the northeast (e.g., Assam and West Bengal) and the coastal regions of the south (e.g., Kerala), rice accounts for over 90% of the total area and production of foodgrains. Rice is also the principal crop in the humid subtropics of southern Bihar, Odisha and eastern Madhya Pradesh (MP), and in the sub-humid subtropics of northern Bihar and eastern Uttar Pradesh (UP). In these regions, farmers have little choice but to grow rice during the hot and humid monsoon season. The top three rice producing states are West Bengal, UP and AP (including Telangana), which together contribute 40% to India’s rice production (Table 1).
Table 1. The relative importance of rice in total foodgrains area and production, by state, India, 1971-73 and 2013-15.
1971-73
2013-15
Area
Prod.
Area
Prod.
Zone/State
(%)
(%)
(%)
(%)
East zone
Assam
92
94
92
96
Bihar
52
53
51
52
Odisha
77
83
81
92
W. Bengal
82
84
87
89
North zone
M. Pradesh
27
32
29
28
Maharastra
11
25
14
26
U. Pradesh
23
21
30
30
West zone
Gujarat
9
11
21
23
Haryana
7
12
29
25
Punjab
12
13
44
40
South zone
A. Pradesh
35
65
56
66
Karnataka
16
35
17
30
Kerala
95
98
99
99
Tamilnadu
53
77
51
62
All zones
Others
8
17
10
14
India
31
41
35
41
Source: Data from Ministry of Agriculture, GOI (2017 and previous years).
Notes:
Paddy rice production at the national level increased from 63 to 160 million tons between 1971-73 and 2013-15—an increase of 2.3% per year (Fig. 1), which is higher than the growth rate of population during the same period. Yield improvement was the major contributor to this production growth. The yield growth contributed 84%, while the area growth contributed only 16% to this production growth (Fig. 2). The paddy rice yield increased from 1.7 to 3.6 t/ha over the last four decades. The higher growth rate of rice production than population led to substantial increase in per capita rice production. Per capita paddy rice production increased from 108 kg to 126 kg from the early 1970s to the late 1990s, despite 70% increase in the country’s population in the same period. It decreased in the early 2000s, but again stared rising since the late 2000s reaching 128 kg in 2013-15. The substantial increase in per capita rice production resulted in an adequate supply of rice at affordable prices, which was instrumental to improve national food security, reduce poverty, and uplift rural livelihoods.
Fig. 1. Growth aate in area, production and yield during early and late green revolution periods in India
Fig. 2. Trends in rice (paddy) area, production, and yield in India, 1970-2015.
Source: Data from Ministry of Agriculture, GOI (2017 and previous years).
The national level aggregate values mask a large heterogeneity in rice area, yield, and production across the Indian states. Rice yield has increased significantly in all states over the past four decades, although the magnitudes of increase vary considerably. In the early 1970s, Paddy rice yield across states ranged from 1.1 to 3.2 t/ha (Fig. 2) during the early 1970s. The northern states of Punjab and Haryana and southern states of Andhra Pradesh (AP), Karnataka, Kerala and Tamil Nadu had relatively better irrigation infrastructure and quickly started adopting the green revolution technologies (Table 2). As a result, these states achieved a substantially high yield (over 2.0 t/ha) even in the early 1970s. After four decades in 2013-15, paddy rice yield across states ranged from 2.2 to 5.9 t/ha. Paddy yield is about 4.0 t/ha or above in West Bengal, Punjab, Haryana, and all major rice growing southern states. But the yield is still considerably lower in many other states, especially the eastern Indian states (Fig. 3).
Table 2. Input use intensification in rice farming, by state, India, 1970-2013.
Rice irrigated area (%)
Rice area under high
yielding varieties (%)
Fertilizers use per hectare
of gross cropped area (NPK, Kg/ha)
Zone/State
1985-87
2012-14
1970-72
2008-10
1975-76
2013-14
East zone
Assam
23
11
10
65
2
65
Bihar
36
46
8
66
13
165
Odisha
33
33
6
79
7
98
W. Bengal
24
47
13
94
17
131
North zone
M. Pradesh
20
34
9
45
5
84
Maharastra
30
26
17
94
14
127
U. Pradesh
37
85
19
79
21
149
West zone
Gujarat
53
65
14
87
15
120
Haryana
99
100
23
50
19
179
Punjab
98
100
63
99
52
217
South zone
A. Pradesh
95
97
26
98
31
227
Karnataka
59
74
16
87
20
136
Kerala
43
76
31
91
22
121
Tamil Nadu
90
93
77
87
39
154
All zones
Others
45
55
21
54
9
85
India
44
60
19
79
17
131
Source: Data from Ministry of Agriculture, GOI (2017 and previous years).
Notes: Andhra Pradesh includes Telangana, Bihar includes Jharkhand, M. Pradesh includes Chattisgarh, and U. Pradesh includes Uttarakhand.
Fig. 3. Trends in paddy rice yield in major rice growing states, India, 1971-73 and 2013-15.
Source: Data from Ministry of Agriculture, GOI (2017 and previous years) (2015).
During the first decade of GR (i.e. 1960s), rice production growth was limited to regions with already developed irrigation infrastructure, such as AP, Haryana, Karnataka, Kerala, Punjab, and Tamil Nadu, where farmers quickly adopted HYV suitable for the irrigated ecosystem (Janaiah et al., 2006). In the early 1970s, rice yield had been already high, exceeding 2.3 t/ha in these states (Fig. 3). In Punjab and Haryana, both rice area and yield increased spectacularly that led to a production increase of 250% in Punjab and 180% in Haryana from the early 1960s to the early 1970s. In the traditional rice bowls of eastern India, the diffusion of new technologies started only in the 1980s with (a) the expansion of small-scale groundwater irrigation that allowed farmers to grow HYVs during the dry season (boro rice) and manage monsoon failures during the wet season with supplementary irrigation, (b) the availability of intermediate height HYVs that are suitable for the shallow and medium flooded, poorly drained land that constitute an important sub-ecosystem in these states. As HYVs started spreading in eastern India, the regional aggregate rice yield growth rate jumped from virtually 0 to 4.1% per year and rice production growth rate jumped from 0.1 to 4.7% per year from the 1970s to the 1980s. Across states in eastern India, the rice yield growth rate was negative in all states except West Bengal in the 1970s, but rice yield picked up and maintained in the order of 0.6 to 5.5% per year in the 1980s (Table 3).
Table 3. The decadal growth rate of area, yield, and production of rice, by state, India, 1970-2015 (% per year).
1970-79
1980-89
1990-99
2000-15
Zone/State
A
Y
P
A
Y
P
A
Y
P
A
Y
P
East zone
Assam
1.5
-0.9
0.6
0.5
0.6
1.1
0.1
1.0
1.1
-0.1
2.7
2.6
Bihar
0.5
-0.2
0.3
0.3
3.8
4.1
0.1
4.3
4.4
4.1
6.6
10.7
Odisha
-0.9
-0.5
-1.4
0.4
3.5
3.9
0.2
-1.5
-1.3
-0.7
2.9
2.2
W. Bengal
-0.1
0.8
0.8
1.1
5.5
6.6
0.5
1.9
2.5
-0.6
1.1
0.5
North zone
M. Pradesh
0.9
-4.0
-3.1
0.4
1.7
2.0
0.7
-0.9
-0.1
0.4
5.0
5.4
Maharastra
1.7
5.0
6.7
-0.1
-0.6
-0.7
-0.7
2.1
1.4
0.1
1.9
2.0
U. Pradesh
1.3
0.3
1.6
0.0
5.5
5.5
0.9
2.2
3.1
0.1
1.2
1.3
West zone
Gujarat
0.3
3.8
4.1
0.4
-0.6
-0.2
2.0
1.7
3.7
2.1
4.3
6.4
Haryana
6.4
4.3
10.7
2.4
-0.1
2.2
5.9
-1.7
4.3
2.1
1.1
3.2
Punjab
11.7
5.2
17.0
5.3
1.3
6.5
2.5
0.0
2.5
1.0
0.7
1.7
South zone
A. Pradesh
1.9
2.2
4.1
0.5
1.9
2.5
0.5
1.1
1.7
0.7
0.6
1.3
Karnataka
-0.1
1.5
1.4
0.4
-0.1
0.2
1.7
1.9
3.6
-0.2
0.8
0.6
Kerala
-1.1
0.6
-0.5
-4.2
1.2
-3.0
-5.7
0.7
-5.1
-4.0
1.9
-2.1
Tamil Nadu
0.2
0.2
0.5
-2.0
5.8
3.8
1.1
0.6
1.7
-0.1
1.2
1.1
All zones
Others
2.0
1.5
3.5
-0.1
0.8
0.7
0.5
0.7
1.2
0.7
1.6
2.3
India
0.9
1.0
1.9
0.4
3.1
3.6
0.7
1.3
2.0
0.0
1.8
1.8
Source: Data from Ministry of Agriculture, GOI (2017 and previous years).
Notes: - Abbreviations: A-area, Y-yield, and P-production.
- Andhra PradeshBihar includes Jharkhand, M. Pradesh includes Chattisgarh, and U. Pradesh includes Uttarakhand.
The additional rice production over the past four decades came mostly from the non-traditional rice growing states and the irrigated ecosystem in the traditional belt. During 1970‒2013, India’s paddy area increased by 6.1 million ha and paddy yield increased by 2.0 t/ha, which together lead to a production increase of 95.4 million tons (Table 4). The share of different states to the national rice production changed considerably during that period. It decreased from 40 to 35% in the eastern zone, increased from 20 to 26% in the northern zone, increased from 4 to 16% in the western zone, and decreased from 33 to 21% in the southern zone. Of the incremental rice production over the past four decades, the eastern states contributed 31%, the northern states contributed 30%, the western states contributed 23%, and the southern states contributed 14%. Punjab’s share in the national rice production was only 2% in the early 1970s, but this increased to 10% in the early 2010s. Punjab contributed 16% to the incremental rice production over the past four decades (Table 4). Punjab benefitted the most from the green revolution in rice farming as it had developed reliable irrigation infrastructure and enterprising farmers with a relatively large size of farm holdings (Table 2).
Table 4. The relative importance of rice area and production, by state, India, 1971-73 and 2011-13.
Rice area and production
Share of states to all India
1971-73
2013-15
1971-73
2013-15
A
P
A
P
A
P
A
P
Zone/State
(Mha)
(Mt)
(Mha)
(Mt)
(%)
(%)
(%)
(%)
East zone
Assam
2.0
3.1
2.5
7.6
5
5
6
5
Bihar
5.1
6.9
4.7
13.9
14
11
11
9
Odisha
4.6
6.0
4.1
10.9
12
10
9
7
W. Bengal
5.1
9.0
5.5
23.0
14
14
12
15
North zone
M. Pradesh
4.5
5.2
5.8
14.4
12
8
13
9
Maharastra
1.3
1.9
1.6
4.3
4
3
4
3
U. Pradesh
4.5
5.5
6.2
31.1
12
9
14
20
West zone
Gujarat
0.4
0.6
0.8
2.6
1
1
2
2
Haryana
0.3
0.8
1.3
6.1
1
1
3
4
Punjab
0.5
1.5
2.9
17.1
1
2
7
11
South zone
A. Pradesh
3.1
7.3
3.8
17.5
8
12
9
11
Karnataka
1.1
3.0
1.3
5.1
3
5
3
3
Kerala
0.9
2.0
0.2
0.8
2
3
0
1
Tamil Nadu
2.7
8.2
1.8
9.3
7
13
4
6
All zones
Others
1.3
2.3
1.6
5.2
3
4
4
3
India
37.6
63.2
43.9
158.3
100
100
100
100
Source: Data from Ministry of Agriculture, GOI (2017 and previous years).
Notes:
Rice exports
India is a traditional exporter of a special quality rice, basmati to the Middle East, Europe and USA. However with the substantial increases in production of rice-both basmati and non-basmati rice- after mid-1990s, India became a leading rice exporter in the world during the recent past. At present, rice accounts for about 20% of total India’s agriculture exports in terms of value. India is mainly exporting rice into two categories such as basmati rice and non-basmati rice. Sella Rice, Steamed Rice, and Pusa Rice are the different types of rice that are exported under basmati rice category. While Parboiled Rice, Broken Rice, Sella Rice, Swarna Rice and Sona Masoori Rice are the types that are exported under non-basmati Rice category. The export of basmati rice has significantly increased from about one million tonnes to abot 4 million tonnes during the past ten years (Table 5). Similar quantum jump was registered in the export of non-basmati rice by 2.5 to 3 times increase during the same period. Total rice export from India during 2014-15 was all-time record, i.e. about 12 million metric tons, which is about 30% of global rice exports. The total value of rice exports during 2014-15 was approximately US 9 Billion, of which the share of basmati rice was about 56%. In 2015-16 and 2016-17, basmati rice exports have increased by about 10% over previous years, but non-basmati rice exports have declined after 2014-15 (Table 5). The Indian basmati rice and non-basmati rices have fetched price of US $ 1010 and 413 per metric tons respectively in the world rice market during 2016-17.
Table 5. Rice exports from India during 2004 - 05 to 2014 -15
(Quantity in million metric tonnes)
Year
Basmati
Non-Basmati
Total
2004-2005
1.163
3.615
4.778
2005-2006
1.167
2.922
4.089
2006-2007
1.046
3.702
4.748
2007-2008
1.183
5.286
6.469
2008-2009
1.556
0.932
2.488
2009-2010
1.217
0.140
1.357
2010-2011
2.371
0.101
2.472
2011-2012
3.178
3.998
7.176
2012-2013
3.460
6.688
10.148
2013-2014
3.757
7.019
10.776
2014-2015
3.702
8.274
11.976
2015-2016
4.047
6.373
10.420
2016-2017
4.104
6.815
10.915
Source: Government of India ( 2010, 2018)
Up until the early 1990s, Pakistan dominated the world basmati rice market, but significant increases in production due to improved technologies and farm management practices, upgrading of postharvest systems (drying, storage, milling, and processing), improved value addition (packaging and branding), and wider marketing brought success to the Indian basmati industry and has made India the leader in the world basmati rice market today. Favorable trade policy and licensing procedures for agricultural exports, private-sector efforts to promote rice exports, and the zeal of basmati rice exporters to establish themselves as reliable suppliers contributed to the success of the Indian basmati industry. Like-wise, surplus production of high-quality non-basmati rice varieties such as Samba Masuri and Jyothi made India to increase overall rice exports during the past one decade. However, there has been a wide fluctuations in the export quantity of non-basmati rice over the period (Table 5) due to fluctuations in domestic supply, and uncertain government trade policy on foodgrains exports.
NATURE OF RICE FARMING
Rice is widely grown by nearly 120 million farmers in total cropped area of 43 million hectares. About 80-85% of rice farmers are small and marginal whose average farm size is less than one hectare. Rice farming for these small and marginal farmers is subsistence in nature in rainfed areas who produce rice mainly for domestic consumption with little marketable surplus. However rice is emerged as a commercial crop under irrigated areas of north and south Indian where farmers produce paddy mainly for market. In India, about 85 to 90% of total rice production is consumed domestically.
Rice is cultivated under diverse production environments i.e. irrigated ecosystem, rainfed ecosystem and deep-water condition , which accounts for 56%, 38% and 6% of rice land area in India. Rice is mainly grown in wet season (June to Nov) accounting for about 70% of rice area while dry season (Dec -April) occupies remaining 30% where assured irrigation is available. . Farmers harvest about 5 to 5.5 tons/ha of paddy yields during wet season under irrigated ecosyem. In dry season under irrigated condition, paddy yield is about 20-25% higher than in wet season. Under rainfed and deep-water conditions, farmers get average paddy yield of only 3 to 4.5 tons/ha.
Farmers follow transplantation method of crop establishment mainly under irrigated ecosystem, where farmers use 20-25 days old seedlings from paddy nursery for transplantation. In general, farmers follow zig-zag method of transplantation (not line row method). Broadcasting of three to four days old sprouted paddy seeds is a common method under rainfed upland areas where paddy yields are low. Farmers use 100 to 120 kg of nitrogen, 40-60 kg of phosperous and 40 to 50 kg of potassium per hectare in three to four splits in different form. The use of organic manures and fertifizers has declined over the period due to substantial reduction in livestock population in rural India. Nearly 85 to 90% of India’s rice is now covered with high yielding varieties (HYVs). Hybrid rice coverage in the farmers’ fields is very meagre, i.e. less than 3% of total rice area. In India, total of about 1200 HYVs and hybrids were developed and released by various R&D institutions over the past five decades. However, the 30 most popular HYVs covered in 75% of rice area in India (Janaiah and Hossain, 2005). On an average, farmers replace paddy seeds with newly purchased certified seeds once in three to four years; i.e. seed replacement rate is about 25 to 33% in India (Janaiah and Debdutta, 2016). Paddy farmers adopt integrated pest and disease management practices against major insect pests such as stem borer, brown plant hopper, leaf folder, gall midge, etc and major diseases such as blast, bacterial leaf blight, sheath blight, tungro, etc. Rice farming in India including under rainfed areas is largely mechanized as farmers use modern machinery for ploughing and puddling (tractors, power tillers), irrigation (pump-sets), transplantation (transplanters only in some areas), and harvesting, threshing and winnowing (mini and combine harvesters and threshers). In many rice areas, farmers follow chemical weeding. Increasing labour shortage for farming and decreasing livestock in rural India are two key reasons for increased mechanisation and chemicalization of rice farming in India. At present, cost of producing one metric tonne of paddy rice under irrigated input intensive areas is about US $ 200 to 250, while it is about 150 to 180 in rainfed regions.
MARKETING CHANNELS AND VALUE CHAIN
An efficient marketing with value chain is crucial for transforming the rice sector into an industry mode. Rice farming is a subsistence activity for half of the small and small farmers under rainfed rice areas whose marketable surplus is small portion of their rice production. Large quantity of marketable surplus of rice is generated in the southern and north Indian states. At national level, 75% of paddy production is marketable surplus, largely generated in the irrigated regions of south and north Indian states as well as by large farmers in other parts of the country (Government of India, 2016). Most of the marketable paddy surplus is sold out by farmers in the form of paddy after drying and bagging. Small and marginal farmers sell their produce after retaining required quantity for their home consumption to local village traders at relatively lower price right at the threshing yard. Large and medium sized farmers whose marketable surplus is substantially more sell paddy to rice millers or supply formal public agencies at higher price. In either case including basmati rice farmers (except contract farmers of few big companies), paddy farmers sell only paddy after very little value addition except drying and bagging. About 90% of paddy marketable surplus is marketed through the various channels. There is a huge public sector manageing and marketing network in India with many agencies and institutions, which were set up in the 1960s and 70s. There are four forms of marketing channels through which paddy farmers sell their surplus paddy in India.
Public sector marketing agencies
The State Civil Supplies Corporation (SCSC) at state level and Food Corporation of India-FCI at the national level are two major public sector agencies that procure paddy rice through direct purchase centres mainly in surplus regions of the north-west and southern states. These agencies also procure rice (milled) through rice millers to maintain central buffer stocks. An important issue is that most of these agencies are old and not modernized in lines with demand. Nearly 25 to 30% of total marketable surplus of paddy rice is procured through these agencies. Farmers get paid government’s fixed minimum support price (MSP) for their produce from agencies. However the operation of these agencies is very limited or even absent in the eastern, north-eastern and some central Indian states.
Regulated Markets (Agril. Market Committees):
There are about 8000 regulated markets and 32,000 rural and wholesale markets with government-controlled committees are functioning in the country. These markets are managed by farmers’ representatives and financially self-sustained because; these markets collects 1% of farm produce values as a cess from purchasers, and use this income for market development. All transactions between farmers and licensed traders in these markets are monitored and regulated by respective State Department Officials in order to avoid malpractices and to facilitate fair trade through open auction method. All types of farmers especially medium and large farmers who were out of reach of FCI and SCSCs purchase centres bring their paddy to these markets for selling. Farmers may get competitive price in these markets as open auction method is followed by licensed traders to buy paddy from farmers. This price may less or more than MSP depends upon supply-demand situation on day to day basis. These markets purchase 30 to 35% of total marketable surplus of paddy in the country.
Women elf-elp roups
There are 12 million Women Self-Help Groups (WSHGs) in India, formed by village women themselves with the support of government and rural financial institutions over the past two decades. They are functioning as gross root level institutions especially for empowerment of rural women. Recently, these WSHGs are permitted in southern states to buy paddy directly from the farmers on behalf of State Civil Supplies Corporation, and millers for which Rs 1 per bag of 70 kg will be paid to WSHGs as a commission. About 3 to 4 million tons of paddy procured by WSHGs mainly in south Indian states.
Open Market (Village traders)
In addition to above channels, a large numbers of traders are buying farm produce from farmers and sell it to the millers. Most of these traders are village level business people, money lenders, etc who often lend loans to the small and marginal farmers with a condition that farmers sell their produce to these traders. Most of small farmers usually sell their produce to the village traders, which accounts for 30 to 35% of total marketed surplus. Generally, farmers get paid relatively lower price by the local traders.
Value addition
The value addition in rice sector is largely confined to drying and bagging of paddy at the farmers’ level, milling, cleaning and separation at millers’ point, and bagging with different sizes of quantity at wholesale point. In case of exportable basmati rice, some registered companies have contracts with farmers and provide required technical advises and quality seeds to farmers to produce quality basmati rice. These companies involved in grading, cleaning, packing and branding in order to meet requirements of global rice markets. There are about 100 different registered companies engage in rice trading of in India-both for export and domestic markets. These companies also started grading, packing and branding of quality non-basmati rice for providing to the high income consumers through different super markets and big retailers. Unlike earlier, rice in small packages of various sizes, varying from one to 25 kg are now available with brand names in some big retailing malls in urban areas. But the share of packaged and branded rice in the total rice sales to consumers is meagre, i.e. less than 10%. However demand for branded and packaged rice is increasing in urban India. Historically, the Indian consumers eat rice in the form of cooked and steamed rice. Rice-based processing industry is very small in India, and confined to only few rice based products for occasional consumption.
At present, only 5 to 6% of total farm output is passing through modern value chain and processing in India. Thus, the gross value of agri-value chain (both inputs and outputs is estimated at only US$ 960 Billion, although the value of raw farm output is about US$ 400 Billion. Rice is an important component of agri-value chain in India. The value of paddy rice accounts for about 8% of total value of raw agriculture output in India. Nearly 85-90% of rice production is consumed domestically, largely in the form of cooked/steamed rice. Therefore the share of rice-based products in the dietary system is negligible, however it is increasing in recent years. Thus, the gross value of rice value chain is only about US$ 71 Billion, of which share of value addition is only 28% (wholesale and retail traders’ share), and -54% is for farmers’ share (farm-gate price) and by-product value is 18%. The share of rice value chain in the India’s agri-value chain is only 7.4%.
The opportunities for promotion of modern value chain rice are plenty in view of growing consumer demand for processed and value added rice products. Some key challenges that confront the expansion of the rice value chain are (a) small farm size of rice farmers, (b) inadequate institutional and infrastructure, (c) lack of modern milling and processing methods, (d) low yields, (e) weak quality regulation, and (f) traditional food habits of rice consumers-preferences.
CONCLUSION
Rice is a life line for India’s food and nutritional security, and source of the rural livelihood for half billion people. With the introduction of green revolution led high yielding varieties coupled with input uses and government’s policy support, rice production has increased by 250% and yield by 230% between 1971 and 2015. The irrigated regions of north and south Indian performed better in rice sector during the 1970 and 80s while the rainfed areas in eastern, north-eastern and central Indian states have picked up to increase rice yields after mid 1980s. As a result, about 10 to 12 million tonnes of exportable surplus-both basmati (4 million tons) and non-basmati (8 million tons) rice- was generated after meeting domestic consumption requirements. India became leading rice exporter in the world today worth of US $ 9 Billion-an increase in export of basmati rice by four time and non-basmati rice by 3 folds in 2015 over 2005.
Rice is grown by about 120 million farmers under diverse ecosystems across India, of which 80 to 85% are small and marginal. Farmers follow different methods of crop establishment with improved seeds of HYVs and other inputs, varying from one ecosystem to other. Nearly 75% of India’s rice production is marketable surplus-largely generated by irrigated rice farmers in north and south Indian states as well as large farmers in other parts of the country. The marketing system for rice has huge network-both under public and private sector-that purchase paddy from farmers. Nearly 85-90% of total rice production is domestically consumed in the form of cooked and steamed rice. Thus, rice value chain is largely confined to drying at farmers’ level, and milling and bagging at millers and traders’ level. Total value of rice value chain in India is estimated at only US $ 71 Billion (58% of it is raw paddy value), which is only 7.4% of gross agri-value chain. In case of basmati rice, registered companies provide considerable services to contracted farmers for maintain quality of produce through various value addition activities. However, there is a huge potential to promote rice based products through modern value chain in view of rising demand for processed and packaged foods, driven by rapid urbanisation, feminisation, diet diversification and increase in incomes of middle class consumers in urban areas. Rice farmers’ income cannot be increased in future without promotion of value addition and rice based processing. At present, farmers’ get market price of only US $ 200 to 250 per ton of raw paddy without any value addition. If C-3 category cost of production is considered (includes all operational costs, imputed value of own family labour and rental value of land, interest on fixed capital and depreciation on farm equipments), farm-gate price of paddy is nearly same as C3 costs (Government of India, 2017). Further, promotion of rice value addition on large scale will generate huge employment opportunities for youth besides increasing farmers’ income. The key challenges constraining rice value chain are traditional food habits, lack of modern infrastructure, presence of large number of small and marginal farmers in rice sector, etc.
REFERENCES
Government of India (2017), Price policy for Kharif crops-2017, Commission for Agriculture Costs and Prices, Ministry of Agriculture and Farmers’ Welfare, Government of India, New Delhi.
Government of India (2017), Agriculture statistics at a glance-2016-17, Directorate of Economics and Statistics, Ministry of Agriculture and Farmers’ Welfare, Government of India, New Delhi.
Government of India (2010, 2018), Commodity Profile: Rice -2010 and 2018, Directorate of Economics and Statistics, Ministry of Agriculture and Farmers’ Welfare, Government of India, New Delhi.
Janaiah, Aldas and Debdatta, B (2017), Rice Seed System in India: Institutional and Policy Issues” In The Future of Rice Strategy for India” (edited by Samarendu Mohanty, and others),Elsvier Publishers, UK
Janaiah, A., Hossain, M., Otsuka, K. 2006. Productivity impact of the modern varieties of rice in India. The Developing Economies, 44(2):190-207.
Janaiah, Aldas, Keijiro Otsuka and Mahabub Hossain (2005). Is the Productivity Impact of the Green Revolution in Rice Vanishing? Empirical Evidence from TFP Analysis for Rice. Economic and Political Weekly, Vol. 40 (53), Pp. 5596-5600
Janaiah, Aldas and Mahabub Hossain (2004). Partnership in the Public Sector Agricultural R & D: Evidence from India. Economic and Political Weekly, Vol. 39 (50), pp. 5327-5334
Jha, D., Kumar, P. 1996. Rice production and impact of rice research in India. Paper presented at the International Conference on the Impact of Rice Research. Bangkok, Thailand, 3-5 June 1996.