ABSTRACT
Thailand is, presently, ranked sixth in the world in terms of rice production and second in terms of rice export. The market share is about 20 %. Besides being a staple food for the Thai people, rice is also very important to the Thai economy. It shared about 15% of agricultural gross domestic product (GDP) and ranked second after rubber in exporting value of agricultural products.
About half of the agricultural land of the country is devoted to rice growing and most of rice farmers are small famers. The average paddy planted area is only about 3 hectares per household. About 33 % of rice farmers are above 60 years old with the average age of 56 years.
the current agricultural policies of the Ministry of Agriculture and Cooperatives (MOAC) include establishing the rice restructuring plan in order to reduce the over rice production to match with the demand. The cost reduction and product quality improvement as well as value creation programs are emphasized. Niche market products such as organic rice, nutritious rice and geographical (GI) rice are also promoted. The area – based extension approach is adopted to implement the above policies. The government incentives provided include equipment, technology transfer, soft loans, direct payment and assistance in market linkages.
Keywords: Agricultural policies, restructuring plan, cost reduction, product quality improvement, value creation, niche market, organic rice, GI rice, area – based extension
INTRODUCTION
Thailand is still considered as an agricultural country even though the share of agricultural sector in the gross domestic product (GDP) has declined continuously. Presently, the agricultural sector contributes less than 10% to its national GDP l.However, majority of the people still live on farm in the rural areas and depend on agricultural activities for their source of livelihood. Agriculture provides food not only enough for domestic consumption but also has a surplus for export to earn a significant amount of foreign exchange for the country. Furthermore, most of the economic progress has been derived, directly or indirectly, from agricultural development. In the old days, for many Thai farmers, rice farming is a way of life for them. A small piece of land, whenever they have, most of them think first about growing rice for household consumption regardless of the prices they will receive. However, keeping rice for household consumption has been decreasing nowadays due to the change in harvesting practice from manual to combine machine which the farmers, generally, sell all their paddies immediately to the local assemblers right after harvest. Apart from being an important crop that has significant impact on the national economy, rice farming has also contributed much to the national culture. The royal ploughing ceremony is organized in May of every year. Due to the importance of rice and rice farmers, in 2009 the government has decided to designate the fifth of June of every year as the “National Rice and Rice Farmers Day”. This day was selected because in June 5, 1946 the late King Rama 8 together with the late King Rama 9 (then the brother of the King Rama 8) had visited the paddy field in Bangkhen district, Bangkok suburb and broadcasted rice seeds into the field. Furthermore, the rice farmers has always been recognized by the Thai people as “The Backbone of the Country”.
The Thai economy very much relies on its exports. The export earning constituted about 60 % of the total GDP. Agricultural exports share about 20 % of the total export value. Major agricultural exports in terms of value are rubber, rice, shrimp, processed fish, sugar and cassava, respectively. Many agricultural commodity exports are ranked first or very high on the list in terms of world market share.
From the total land area of 320.7 million rais (51.3 mill. hectares), it can be categorized into 3 major groups as agricultural land which, in 2017 occupied about 23.9 million hectares or about 47 % of the total land area, the forest area covered about 17.2 million hectares or about 33 % and the rest are non – agricultural land which are used for housing, commercial and industrial purposes. For agricultural land, about 11.2 million hectares or about47 % of agricultural land are classified as paddy fields ).
In this paper, the relative importance of Thai rice to the country’s economy and to the world in terms of production and trade, Thai rice markets, characteristic of rice farmers and rice farming system will be presented. The government policies and activities implemented towards high value products will be also described.
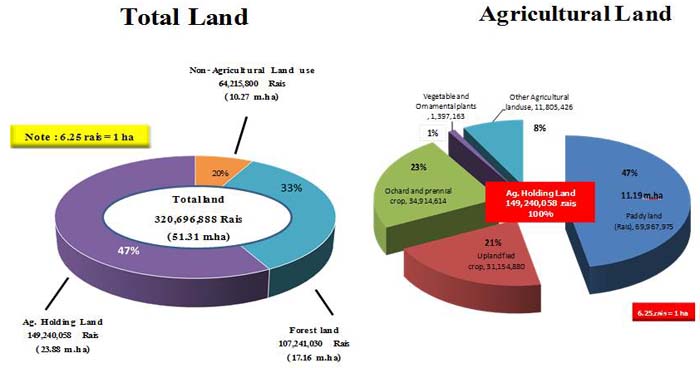
Fig. 1. Land Use of Thailand 2017
Source: Office of Agricultural Economics (OAE)
RICE INDUSTRY IN THAILAND
Importance of Thai rice
In Thailand, rice is the most important crop in many aspects. It is a staple food for the Thai people and a major source of foreign exchange earning as well as a major source of employment. Rice production contributes about 15 % of its agricultural GDP which is the first in ranking among agricultural products. It ranked second after rubber in terms of export earnings.
Thailand is currently ranked sixth in the world in rice production but constitutes only about 4 % of the world production. For export, Thailand is ranked second in rice export which have market share of about 24 % of the world rice trade. The world rice production and trade is shown in Table 1. However, for more than 30 years, Thailand used to consistently rank number one in rice export in the world until it lost its position to India and Vietnam in 2012. Over the last 50 years, the rice export from Thailand has increased from about 2 million tons to about 10 million tons with an average annual growth of about 4.4 %. During the same period, the world rice trade has increased from about 5 million tons to about 40 million tons with an average annual growth of about 3.6 %. However, the market share of Thai rice during this period has fluctuated from as low as 10 % to the highest point at more than 40 % (Fig. 2).
Table 1. World rice production, exports and imports, 2017
|
Country
|
Production
|
Country
|
Exports
|
Country
|
Imports
|
|
(Mill. Tons)
|
(%)
|
(Mill. Tons)
|
(%)
|
(Mill. Tons)
|
(%)
|
|
China
|
144.95
|
30
|
India
|
12.3
|
26
|
China
|
5.5
|
12
|
|
India
|
110.15
|
23
|
Thailand
|
11.614
|
24
|
Nigeria
|
2.5
|
5
|
|
Indonesia
|
36.86
|
8
|
Vietnam
|
6.488
|
14
|
EU
|
1.875
|
4
|
|
Bangladesh
|
34.58
|
7
|
Pakistan
|
3.6
|
8
|
Iran
|
1.6
|
3
|
|
Vietnam
|
27.4
|
6
|
USA
|
3.384
|
7
|
Saudi Arabia
|
1.4
|
3
|
|
Thailand
|
19.2
|
4
|
Myanmar
|
3.2
|
7
|
Ivory Coast
|
1.35
|
3
|
|
Myanmar
|
12.65
|
3
|
Cambodia
|
1.15
|
2
|
Philippines
|
1.1
|
2
|
|
Philippines
|
11.69
|
2
|
Uruguay
|
1
|
2
|
Iraq
|
1.07
|
2
|
|
Brazil
|
8.38
|
2
|
Brazil
|
0.594
|
1
|
Malaysia
|
1
|
2
|
|
USA
|
7.12
|
1
|
Argentina
|
0.392
|
1
|
Indonesia
|
0.3
|
1
|
|
Others
|
73.8
|
15
|
Others
|
3.827
|
8
|
Others
|
29.854
|
63
|
|
World
|
486.78
|
100
|
World
|
47.549
|
100
|
World
|
47.549
|
100
|
Source: World Markets & Trade, USDA, February 2018
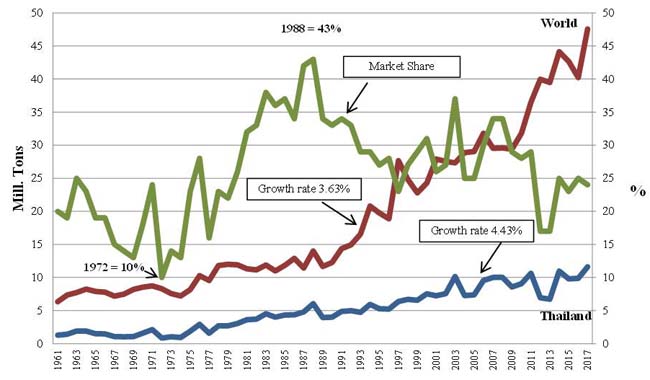
Fig. 2. Quantity of World Rice and Thai Rice Export and Market Share, 1961 – 2017
Source: IRRI and Thai Rice Exporters Association
Thai rice markets
In 2017, Benin is the biggest importer of Thai rice , followed by China and the United States, respectively (Table 2). Most of the Thai rice exports were white rice followed by Hommali Rice (Jasmine or fragrant rice) and parboiled rice, respectively (Table 2). The top ten customers of Thai rice by type of rice are shown in Table 3 Table 4 and Table 5.
In general, Thai rice is considered as a good quality rice which can be justified by the average FOB prices of major exporting countries such as India and Vietnam. The annual average of FOB prices for 5% white rice between 2012 and 2017 for Thailand, India and Vietnam is shown in Table 6. The FOB prices of Thailand are above the fob prices of both India and Vietnam while the FOB prices of India are higher than the FOB prices of Vietnam.
Table 2. Quantity and value of Thai rice exports by countries of destination and type of rice, 2017
|
Country of destination
|
Quantity
|
Value
(Mill. Baht)
|
Type of rice
|
Quantity
|
Value
|
|
(Ton)
|
(%)
|
(Ton)
|
(%)
|
(Ton)
|
(%)
|
|
Benin
|
1,811,164
|
16
|
23,114
|
White Rice
|
5,050,047
|
42
|
62,766
|
32
|
|
China
|
1,199,737
|
10
|
19,352
|
Hommali Rice
|
2,299,262
|
19
|
51,237
|
26
|
|
USA
|
503,517
|
4
|
13,368
|
Parboiled Rice
|
3,373,184
|
28
|
44,629
|
23
|
|
Republic of South Africa
|
775,175
|
7
|
10,502
|
Glutinous Rice
|
514,740
|
4
|
8,956
|
5
|
|
Cameroon
|
744,508
|
6
|
9,121
|
Pathumthani Rice
|
378,965
|
3
|
6,399
|
3
|
|
Bangladesh
|
550,119
|
5
|
7,081
|
Others
|
12,105
|
0
|
515
|
0
|
|
Ivory Coast
|
492,911
|
4
|
6,290
|
Sub – Total
|
11,628,303
|
97
|
174,502
|
90
|
|
Others
|
5,551,172
|
48
|
85,675
|
Rice Products
|
311,926
|
3
|
18,867
|
10
|
|
Total
|
11,628,303
|
100
|
174,503
|
Total
|
11,940,232
|
100
|
193,370
|
100
|
|
(5,817 Mill. US$)
|
(6,446 US$)
|
Source: Office of Agricultural Economics
Table 3. Thai rice markets by countries of destination for white rice and parboiled rice, 2017
|
Country of
destination
|
White rice
|
Country of
destination
|
Parboiled rice
|
|
(Ton)
|
(Mill. Baht)
|
(Ton)
|
(Mill. Baht)
|
|
China
|
606,358
|
7,493
|
Benin
|
1,314,492
|
17,165
|
|
Benin
|
478,572
|
5,624
|
Republic of South Africa
|
736,666
|
9,888
|
|
Mozambique
|
444,343
|
5,367
|
Bangladesh
|
537,209
|
6,914
|
|
Cameroon
|
450,989
|
5,167
|
Cameroon
|
251,988
|
3,347
|
|
Angola
|
389,656
|
5,109
|
Yemen Republic
|
146,210
|
1,928
|
|
Japan
|
335,812
|
4,167
|
Soviet (Russian)
|
39,079
|
536
|
|
Philippines
|
278,485
|
3,451
|
Algeria
|
36,178
|
474
|
|
Malaysia
|
254,834
|
3,221
|
Niger
|
30,331
|
405
|
|
Kenya
|
170,777
|
2,176
|
United Arab Emirates
|
27,831
|
389
|
|
Iran
|
143,123
|
1,881
|
Spain
|
21,747
|
353
|
|
Others
|
1,497,097
|
19,111
|
Others
|
231,454
|
3,229
|
|
Total
|
5,050,047
|
62,766
|
Total
|
3,373,184
|
44,629
|
|
(5,817 Mill. US$)
|
(1,488 Mill. US$)
|
Source: Office of Agricultural Economics
Table 4. Thai rice markets by countries of destination for hommali rice (fragrant rice) and glutinous rice, 2017
|
Country of
destination
|
Hommali rice
(Fragrant rice)
|
Country of
destination
|
Glutinous rice
|
|
(Ton)
|
(Mill. Baht)
|
(Ton)
|
(Mill. Baht)
|
|
USA
|
457,234
|
12,224
|
China
|
249,566
|
4,040
|
|
China
|
301,822
|
7,109
|
Indonesia
|
102,775
|
1,719
|
|
Hong Kong
|
180,532
|
4,796
|
USA
|
19,244
|
547
|
|
Ivory Coast
|
266,890
|
3,594
|
Malaysia
|
17,256
|
326
|
|
Iran
|
120,313
|
2,463
|
Belgium
|
20,955
|
317
|
|
Canada
|
80,350
|
2,161
|
Vietnam
|
11,664
|
229
|
|
Singapore
|
66,666
|
1,943
|
Laos
|
11,650
|
202
|
|
Senegal
|
151,175
|
1,906
|
Japanese
|
8,674
|
177
|
|
Ghana
|
82,665
|
1,675
|
Philippines
|
9,130
|
162
|
|
Australia
|
44,725
|
1,255
|
Taiwan
|
8,512
|
161
|
|
Others
|
546,890
|
12,112
|
Others
|
55,314
|
1,077
|
|
Total
|
2,299,262
|
51,237
|
Total
|
514,740
|
8,956
|
|
(1,708 Mill. US$)
|
(298 Mill. US$)
|
Source: Office of Agricultural Economics
Table 5. Thai rice markets by countries of destination for Pathumthani rice (Fragrant rice) and Colored rice, 2017
|
Country of
destination
|
Pathumthani rice
(Fragrant rice)
|
Country of
destination
|
Colored rice
|
|
(Ton)
|
(Mill. Baht)
|
(Ton)
|
(Mill. Baht)
|
|
Ivory Coast
|
99,019
|
1,241
|
USA
|
2,309
|
116
|
|
China
|
41,372
|
678
|
Hong Kong
|
1,636
|
61
|
|
Singapore
|
25,716
|
593
|
Singapore
|
1,553
|
55
|
|
Hong Kong
|
25,059
|
502
|
Italy
|
1,386
|
54
|
|
Senegal
|
37,783
|
473
|
China
|
618
|
32
|
|
Ghana
|
21,589
|
412
|
Australia
|
496
|
29
|
|
USA
|
12,469
|
284
|
Canada
|
485
|
23
|
|
Israel
|
12,108
|
270
|
Netherlands
|
398
|
21
|
|
Netherlands
|
11,483
|
220
|
Malaysia
|
634
|
19
|
|
Taiwan
|
8,390
|
150
|
France
|
475
|
19
|
|
Others
|
83,978
|
1,576
|
Others
|
2,093
|
82
|
|
Total
|
378,965
|
6,399
|
Total
|
12,082
|
510
|
|
(213 Mill. US$)
|
(17 Mill. US$)
|
Source: Office of Agricultural Economics
Table 6. FOB Prices of rice of major exporting countries for white rice (5%), 2012 – 2017
|
Year
|
Thailand
(US$)
|
India
(US$)
|
Margin
(US$)
|
Vietnam
(US$)
|
Margin
(US$)
|
|
2012
|
575
|
434
|
141
|
432
|
143
|
|
2013
|
517
|
427
|
90
|
362
|
155
|
|
2014
|
423
|
420
|
3
|
415
|
8
|
|
2015
|
386
|
374
|
12
|
358
|
28
|
|
2016
|
397
|
368
|
29
|
359
|
38
|
|
2017
|
398
|
389
|
9
|
373
|
25
|
Source : Thai Rice Exporters Association
Thai rice farmers
Although rice farming in Thailand is a major occupation and occupied about 50 % of the agricultural land, most farmers are still considered as small scale farmers in terms of farm size. About 70 % of the rice farmers have rice planted area less than 20 rais or 3.2 hectares
Regarding the age of the head of rice farms, it revealed that about 33 % of rice farmers are above 60 years with an average age of 56 years Most of rice farm households have 4 family members with theaverage members of 4.5 persons per household . As for the education level, about 80 % of the head of rice farms have finished their education up to primary school only.
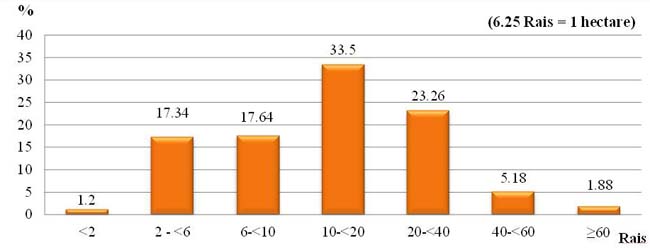
Fig. 3. Percentage of farms by size of rice planted area, 2014/15
Source : Office of Agricultural Economics
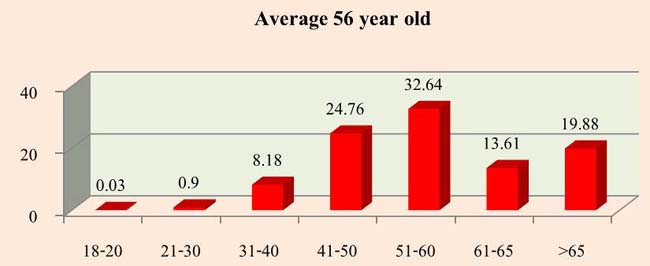
Fig. 4. Age Distribution of rice farm household head, 2011/12
Source : Socio-economic Survey of Rice Farmers, 2011/12, Agricultural Research Development Agency
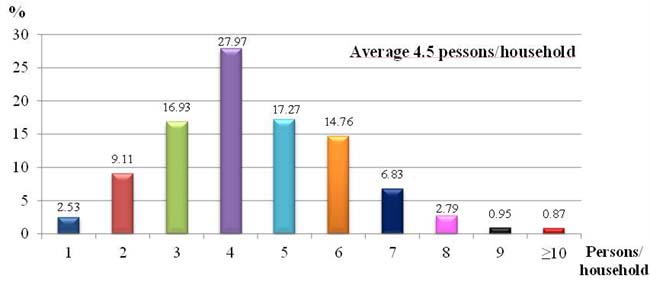
Fig. 5. Family members of rice farm households, 2011/12
Source : Socio-economic Survey of Rice Farmers, 2011/12, Agricultural Research Development Agency
Rice farming system in Thailand
There are four rice ecosystems in Thailand. The rainfed lowland is the largest area which constitutes about 72 % of the total paddy field and mainly located in the northeastern region. The second ecosystem is the irrigated lowland with a share about 20 % of the total paddy area and mostly located in the central plain. The other two ecosystems are deep water and upland rice with a share about 5 % and 3 %, respectively. The irrigated planted areas are varied from one region to the others with the average of about 25 % of the total rice planted area in the country. The highest percentage is in the central region, which have irrigated areas of about 70 %. The lowest This is one of the reasons that make the national average of rice yield in Thailand to be very low. The other reason is that most of the varieties planted are the native variety which generally have very low yield. However, these varieties are very good in quality such as Hommali, RD15 and RD6 (Glutinous rice) which are all fragrant rice.
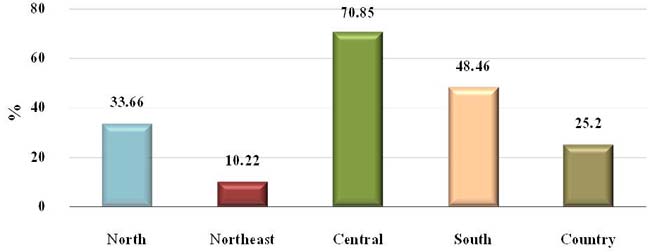
Fig. 6. Percentage of irrigated rice planted area by region, 2014/15
Source: Office of Agricultural Economics (OAE)
Typically, there are two main seasons for rice growing in the country, wet season rice and dry season rice. For the purpose of statistical data collection to avoid double counts, the definitions of wet and dry season rice as defined by OAE are given as follows:
Wet – season rice which is sometimes called major rice refers to the rice grown during the wet season which is May to October except in the eastern coast provinces of the southern region, namely, Nakhon Si Thammarat, Phatthalung, Songkhla, Pattani, Yala and Narathiwat where the wet – season rice is grown during 16 June to 28 February of the following year.
Dry – season rice which is sometimes called second rice refers to the rice grown duiring the dry season which is some time between November and April of the following year except in the above 6 provinces which the dry – season rice is grown during 1 March to 15 June. Most of the second rice areas are in the irrigated area in the central plain.
However, the actual rice season can be varied from year to year depending on the weather condition. In irrigated areas, there is no specific season and farmers may grow rice as many as 3 times a year or 5 times in 2 years.
Rice supply chain in Thailand
In general, rice trade in Thailand is a free market system with many buyers and sellers. However, during the 2011 – 2013 period the free market system has collapsed due to the change in government policy by adopting rice pledging scheme which offered very high mortgage prices compared to the market prices. Thus, most of the paddy produced are channeled to the government pledging scheme. The rice mills could not operate efficiently and many of them became storage of the rice stock of the government. The agricultural cooperatives could not collect the paddy from its numbers to carry out their business.
There are four major stages along the rice supply chain in Thailand which include input acquiring, production, paddy distribution and milled rice distribution. The important inputs used in rice production are seeds, fertilizers and chemicals (insecticides and herbicides).For seeds, most farmers obtained seeds from seed dealers in the local areas. However, some farmers use their own seeds produced by themselves on farms. The use of their own seeds which is now very limited due to the change in harvesting method from manual to combine machine. Community Rice Centers (CRC) which produced seeds for farmers by farmers are also another seed providers in the community. For fertilizers and chemicals, most farmers buy from local dealers which sometimes also give some technical advice and credit to their customers.
Right after harvest, farmers may sell their paddies to the local assemblers or sometimes mobile (ad hoc) assemblers which usually come from other provinces during the peak of the harvesting period. Some farmers may sell it directly to the rice mills in the nearby areas. This is because most of the rice farmers have no drying facilities and no storage. However, some famers may keep some of their paddies for household consumption and for seeds in the next season. The paddies that the farmers kept for household consumption will be milled by small rice mills in the village when it is needed.
After the paddy is milled, most of the millers sell their milled rice to rice exporters through rice brokers. Generally, the big buyers such as exporters and wholesalers will ask the broker to collect milled rice which specify the quantity and the quality (grade) of rice for them. Besides collecting rice, the brokers will also provide credit to buyers by advancing some or all of the amount of money required to buy rice from the millers. In return, brokers will receive a commission about 0.6 – 0.75 % from buyers for their services. For some millers, which have full facilities such as color sorter and packaging machines, they may sell rice directly to buyers such as wholesalers, exporters and oversea importers.
For the domestic market, the milled rice is usually distributed via the wholesalers who bought rice from rice millers and sell it to the retailers around the country and to the modern trade stores or supermarkets as a small rice pack (mainly 5 kg/pack). Some of the milled rice are sold to the rice processing industries for further processing activities to make food and non-food products and sell it in both domestic and oversea markets. However, the secondary or sophisticated rice products are still produced in limited amount compared to the primary products such as regular milled rice. The current rice supply chain in Thailand is shown in Fig. 7.
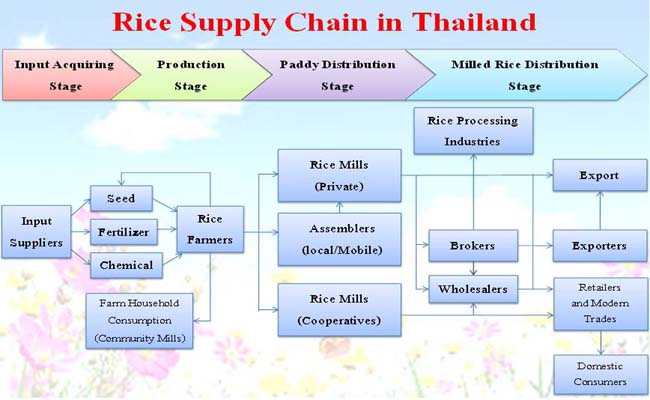
Fig. 7. Rice supply chain in Thailand
The market structure and flow of rice in Thailand is very dynamic because of the many changes in government policies such as change from income warrantee scheme to pledging scheme due to the change in political party which controlled the government administration. The paddy central markets are no longer in existence and the future market is not anymore active in the trading of rice.
CURRENT AGRICULTURAL POLICES OF MOAC
The current policies of the Ministry of Agricultural and Cooperatives (MOAC) that are related to the high value products development can be summarized as follows.
Production policies
1) Establish the restructuring plan in order to reduce the over production to match with the demand.
For rice crop, the existing growing areas are classified into two major zones, suitable areas and unsuitable areas. For suitable areas, improvement of efficiency of production and quality of the products will be emphasized. Moreover, the second rice have to be reduced and changed to other cash crops or green manure crops or left idle during the dry season. For unsuitable area, mixed farming or change to other activities will be promoted by providing the farmers with some incentives.
2) Reduce cost of production and improve quality of products.
The appropriate technologies will be transferred to the rice farmers extensively. The good agricultural practices (GAPs) for rice farming are encouraged and certified.
3) Promote value-added products.
The training courses and equipment and other incentives will be provided. The government supports include packaging equipment and branding development.
Marketing policies
- The market driven strategy will be emphasized.
Production target will be set up to match with the demand before planting time.
- Promote business matching and e – market platforms establishment.
These activities include establishing farmers’ markets in the rural communities, facilitating in price negotiation with the local millers as well as organizing the training courses on how to develop e-market platforms.
- Promote niche market products.
Rice for niche markets include organic rice, geographical indication (GI) rice, nutritious rice, colored rice, native varieties rice and rice for food processing industry.
Targets
- All products have to be safety products in 2022.
- 60 % of all products are organic products in 2027.
Approach
- The area – based extension approach will be adopted to implement the above policies.
The paddy fields of each small farmer in the neighborhood are consolidated to make it look similar to a large farm while the ownership remains unchanged. The objectives of the area-based extension system are to make the promoting target areas to achieve economy of scale in order to increase the bargaining power of farmers. Thus, the cost of production for each small farmer in the area will be reduced while the price received by the farmers will be increased. In doing so, it is also very convenient for government officials to transfer site specific technology to the farmers in the areas and assist them in linking with the buyers. In addition, the area – based approach will facilitate the integration of work among different departments to further improve the efficiency and productivity of rice farming.The farmers’ organization for farmers in the particular large farm will be set up, it’s not yet existing, and the farm manager will be appointed to operate each big farm.
- Local leaning center for each commodity will be established and strengthened.
The best practice farm in each district will be selected to be a local learning center for farmers in each commodity which include rice crop.
CONCLUSION AND RECOMMENDATION
Thai rice is very important nationally and globally. It is a major source of export earning for the country and a major source of rice supply to feed the world. However, Thai rice farmers are still very poor compared to other occupations in the agricultural sector. Most of them are small farmers and are very old. It is very clear that the government wanted to promote high value products for export instead of primary products such as milled rice as usual to avoid competition from other exporting countries. In practice, however, the action taken by the government to further development and enhancing the secondary products business is very limited especially for small farmers and startup business. More researches and investments by the government in the field of value – added product development are needed. Furthermore, the farmers’ organizations and its network should also be established and strengthened especially in developing and operating high value products business. Agro – tourism should also be promoted for people as consumers to visit rice farms and observe rice cultural practices and value – added activities under the concept “Know producer, Know quality”.
|
(Submitted as a paper for the International Seminar on “Promoting Rice Farmers’ Market through value-adding Activities”, June 6-7, 2018, Kasetsart University, Thailand)
|

Thailand’s Rice Industry and Current Policies towards High Value Rice Products
ABSTRACT
Thailand is, presently, ranked sixth in the world in terms of rice production and second in terms of rice export. The market share is about 20 %. Besides being a staple food for the Thai people, rice is also very important to the Thai economy. It shared about 15% of agricultural gross domestic product (GDP) and ranked second after rubber in exporting value of agricultural products.
About half of the agricultural land of the country is devoted to rice growing and most of rice farmers are small famers. The average paddy planted area is only about 3 hectares per household. About 33 % of rice farmers are above 60 years old with the average age of 56 years.
the current agricultural policies of the Ministry of Agriculture and Cooperatives (MOAC) include establishing the rice restructuring plan in order to reduce the over rice production to match with the demand. The cost reduction and product quality improvement as well as value creation programs are emphasized. Niche market products such as organic rice, nutritious rice and geographical (GI) rice are also promoted. The area – based extension approach is adopted to implement the above policies. The government incentives provided include equipment, technology transfer, soft loans, direct payment and assistance in market linkages.
Keywords: Agricultural policies, restructuring plan, cost reduction, product quality improvement, value creation, niche market, organic rice, GI rice, area – based extension
INTRODUCTION
Thailand is still considered as an agricultural country even though the share of agricultural sector in the gross domestic product (GDP) has declined continuously. Presently, the agricultural sector contributes less than 10% to its national GDP l.However, majority of the people still live on farm in the rural areas and depend on agricultural activities for their source of livelihood. Agriculture provides food not only enough for domestic consumption but also has a surplus for export to earn a significant amount of foreign exchange for the country. Furthermore, most of the economic progress has been derived, directly or indirectly, from agricultural development. In the old days, for many Thai farmers, rice farming is a way of life for them. A small piece of land, whenever they have, most of them think first about growing rice for household consumption regardless of the prices they will receive. However, keeping rice for household consumption has been decreasing nowadays due to the change in harvesting practice from manual to combine machine which the farmers, generally, sell all their paddies immediately to the local assemblers right after harvest. Apart from being an important crop that has significant impact on the national economy, rice farming has also contributed much to the national culture. The royal ploughing ceremony is organized in May of every year. Due to the importance of rice and rice farmers, in 2009 the government has decided to designate the fifth of June of every year as the “National Rice and Rice Farmers Day”. This day was selected because in June 5, 1946 the late King Rama 8 together with the late King Rama 9 (then the brother of the King Rama 8) had visited the paddy field in Bangkhen district, Bangkok suburb and broadcasted rice seeds into the field. Furthermore, the rice farmers has always been recognized by the Thai people as “The Backbone of the Country”.
The Thai economy very much relies on its exports. The export earning constituted about 60 % of the total GDP. Agricultural exports share about 20 % of the total export value. Major agricultural exports in terms of value are rubber, rice, shrimp, processed fish, sugar and cassava, respectively. Many agricultural commodity exports are ranked first or very high on the list in terms of world market share.
From the total land area of 320.7 million rais (51.3 mill. hectares), it can be categorized into 3 major groups as agricultural land which, in 2017 occupied about 23.9 million hectares or about 47 % of the total land area, the forest area covered about 17.2 million hectares or about 33 % and the rest are non – agricultural land which are used for housing, commercial and industrial purposes. For agricultural land, about 11.2 million hectares or about47 % of agricultural land are classified as paddy fields ).
In this paper, the relative importance of Thai rice to the country’s economy and to the world in terms of production and trade, Thai rice markets, characteristic of rice farmers and rice farming system will be presented. The government policies and activities implemented towards high value products will be also described.
Fig. 1. Land Use of Thailand 2017
Source: Office of Agricultural Economics (OAE)
RICE INDUSTRY IN THAILAND
Importance of Thai rice
In Thailand, rice is the most important crop in many aspects. It is a staple food for the Thai people and a major source of foreign exchange earning as well as a major source of employment. Rice production contributes about 15 % of its agricultural GDP which is the first in ranking among agricultural products. It ranked second after rubber in terms of export earnings.
Thailand is currently ranked sixth in the world in rice production but constitutes only about 4 % of the world production. For export, Thailand is ranked second in rice export which have market share of about 24 % of the world rice trade. The world rice production and trade is shown in Table 1. However, for more than 30 years, Thailand used to consistently rank number one in rice export in the world until it lost its position to India and Vietnam in 2012. Over the last 50 years, the rice export from Thailand has increased from about 2 million tons to about 10 million tons with an average annual growth of about 4.4 %. During the same period, the world rice trade has increased from about 5 million tons to about 40 million tons with an average annual growth of about 3.6 %. However, the market share of Thai rice during this period has fluctuated from as low as 10 % to the highest point at more than 40 % (Fig. 2).
Table 1. World rice production, exports and imports, 2017
Country
Production
Country
Exports
Country
Imports
(Mill. Tons)
(%)
(Mill. Tons)
(%)
(Mill. Tons)
(%)
China
144.95
30
India
12.3
26
China
5.5
12
India
110.15
23
Thailand
11.614
24
Nigeria
2.5
5
Indonesia
36.86
8
Vietnam
6.488
14
EU
1.875
4
Bangladesh
34.58
7
Pakistan
3.6
8
Iran
1.6
3
Vietnam
27.4
6
USA
3.384
7
Saudi Arabia
1.4
3
Thailand
19.2
4
Myanmar
3.2
7
Ivory Coast
1.35
3
Myanmar
12.65
3
Cambodia
1.15
2
Philippines
1.1
2
Philippines
11.69
2
Uruguay
1
2
Iraq
1.07
2
Brazil
8.38
2
Brazil
0.594
1
Malaysia
1
2
USA
7.12
1
Argentina
0.392
1
Indonesia
0.3
1
Others
73.8
15
Others
3.827
8
Others
29.854
63
World
486.78
100
World
47.549
100
World
47.549
100
Source: World Markets & Trade, USDA, February 2018
Fig. 2. Quantity of World Rice and Thai Rice Export and Market Share, 1961 – 2017
Source: IRRI and Thai Rice Exporters Association
Thai rice markets
In 2017, Benin is the biggest importer of Thai rice , followed by China and the United States, respectively (Table 2). Most of the Thai rice exports were white rice followed by Hommali Rice (Jasmine or fragrant rice) and parboiled rice, respectively (Table 2). The top ten customers of Thai rice by type of rice are shown in Table 3 Table 4 and Table 5.
In general, Thai rice is considered as a good quality rice which can be justified by the average FOB prices of major exporting countries such as India and Vietnam. The annual average of FOB prices for 5% white rice between 2012 and 2017 for Thailand, India and Vietnam is shown in Table 6. The FOB prices of Thailand are above the fob prices of both India and Vietnam while the FOB prices of India are higher than the FOB prices of Vietnam.
Table 2. Quantity and value of Thai rice exports by countries of destination and type of rice, 2017
Country of destination
Quantity
Value
(Mill. Baht)
Type of rice
Quantity
Value
(Ton)
(%)
(Ton)
(%)
(Ton)
(%)
Benin
1,811,164
16
23,114
White Rice
5,050,047
42
62,766
32
China
1,199,737
10
19,352
Hommali Rice
2,299,262
19
51,237
26
USA
503,517
4
13,368
Parboiled Rice
3,373,184
28
44,629
23
Republic of South Africa
775,175
7
10,502
Glutinous Rice
514,740
4
8,956
5
Cameroon
744,508
6
9,121
Pathumthani Rice
378,965
3
6,399
3
Bangladesh
550,119
5
7,081
Others
12,105
0
515
0
Ivory Coast
492,911
4
6,290
Sub – Total
11,628,303
97
174,502
90
Others
5,551,172
48
85,675
Rice Products
311,926
3
18,867
10
Total
11,628,303
100
174,503
Total
11,940,232
100
193,370
100
(5,817 Mill. US$)
(6,446 US$)
Source: Office of Agricultural Economics
Table 3. Thai rice markets by countries of destination for white rice and parboiled rice, 2017
Country of
destination
White rice
Country of
destination
Parboiled rice
(Ton)
(Mill. Baht)
(Ton)
(Mill. Baht)
China
606,358
7,493
Benin
1,314,492
17,165
Benin
478,572
5,624
Republic of South Africa
736,666
9,888
Mozambique
444,343
5,367
Bangladesh
537,209
6,914
Cameroon
450,989
5,167
Cameroon
251,988
3,347
Angola
389,656
5,109
Yemen Republic
146,210
1,928
Japan
335,812
4,167
Soviet (Russian)
39,079
536
Philippines
278,485
3,451
Algeria
36,178
474
Malaysia
254,834
3,221
Niger
30,331
405
Kenya
170,777
2,176
United Arab Emirates
27,831
389
Iran
143,123
1,881
Spain
21,747
353
Others
1,497,097
19,111
Others
231,454
3,229
Total
5,050,047
62,766
Total
3,373,184
44,629
(5,817 Mill. US$)
(1,488 Mill. US$)
Source: Office of Agricultural Economics
Table 4. Thai rice markets by countries of destination for hommali rice (fragrant rice) and glutinous rice, 2017
Country of
destination
Hommali rice
(Fragrant rice)
Country of
destination
Glutinous rice
(Ton)
(Mill. Baht)
(Ton)
(Mill. Baht)
USA
457,234
12,224
China
249,566
4,040
China
301,822
7,109
Indonesia
102,775
1,719
Hong Kong
180,532
4,796
USA
19,244
547
Ivory Coast
266,890
3,594
Malaysia
17,256
326
Iran
120,313
2,463
Belgium
20,955
317
Canada
80,350
2,161
Vietnam
11,664
229
Singapore
66,666
1,943
Laos
11,650
202
Senegal
151,175
1,906
Japanese
8,674
177
Ghana
82,665
1,675
Philippines
9,130
162
Australia
44,725
1,255
Taiwan
8,512
161
Others
546,890
12,112
Others
55,314
1,077
Total
2,299,262
51,237
Total
514,740
8,956
(1,708 Mill. US$)
(298 Mill. US$)
Source: Office of Agricultural Economics
Table 5. Thai rice markets by countries of destination for Pathumthani rice (Fragrant rice) and Colored rice, 2017
Country of
destination
Pathumthani rice
(Fragrant rice)
Country of
destination
Colored rice
(Ton)
(Mill. Baht)
(Ton)
(Mill. Baht)
Ivory Coast
99,019
1,241
USA
2,309
116
China
41,372
678
Hong Kong
1,636
61
Singapore
25,716
593
Singapore
1,553
55
Hong Kong
25,059
502
Italy
1,386
54
Senegal
37,783
473
China
618
32
Ghana
21,589
412
Australia
496
29
USA
12,469
284
Canada
485
23
Israel
12,108
270
Netherlands
398
21
Netherlands
11,483
220
Malaysia
634
19
Taiwan
8,390
150
France
475
19
Others
83,978
1,576
Others
2,093
82
Total
378,965
6,399
Total
12,082
510
(213 Mill. US$)
(17 Mill. US$)
Source: Office of Agricultural Economics
Table 6. FOB Prices of rice of major exporting countries for white rice (5%), 2012 – 2017
Year
Thailand
(US$)
India
(US$)
Margin
(US$)
Vietnam
(US$)
Margin
(US$)
2012
575
434
141
432
143
2013
517
427
90
362
155
2014
423
420
3
415
8
2015
386
374
12
358
28
2016
397
368
29
359
38
2017
398
389
9
373
25
Source : Thai Rice Exporters Association
Thai rice farmers
Although rice farming in Thailand is a major occupation and occupied about 50 % of the agricultural land, most farmers are still considered as small scale farmers in terms of farm size. About 70 % of the rice farmers have rice planted area less than 20 rais or 3.2 hectares
Regarding the age of the head of rice farms, it revealed that about 33 % of rice farmers are above 60 years with an average age of 56 years Most of rice farm households have 4 family members with theaverage members of 4.5 persons per household . As for the education level, about 80 % of the head of rice farms have finished their education up to primary school only.
Fig. 3. Percentage of farms by size of rice planted area, 2014/15
Source : Office of Agricultural Economics
Fig. 4. Age Distribution of rice farm household head, 2011/12
Source : Socio-economic Survey of Rice Farmers, 2011/12, Agricultural Research Development Agency
Fig. 5. Family members of rice farm households, 2011/12
Source : Socio-economic Survey of Rice Farmers, 2011/12, Agricultural Research Development Agency
Rice farming system in Thailand
There are four rice ecosystems in Thailand. The rainfed lowland is the largest area which constitutes about 72 % of the total paddy field and mainly located in the northeastern region. The second ecosystem is the irrigated lowland with a share about 20 % of the total paddy area and mostly located in the central plain. The other two ecosystems are deep water and upland rice with a share about 5 % and 3 %, respectively. The irrigated planted areas are varied from one region to the others with the average of about 25 % of the total rice planted area in the country. The highest percentage is in the central region, which have irrigated areas of about 70 %. The lowest This is one of the reasons that make the national average of rice yield in Thailand to be very low. The other reason is that most of the varieties planted are the native variety which generally have very low yield. However, these varieties are very good in quality such as Hommali, RD15 and RD6 (Glutinous rice) which are all fragrant rice.
Fig. 6. Percentage of irrigated rice planted area by region, 2014/15
Source: Office of Agricultural Economics (OAE)
Typically, there are two main seasons for rice growing in the country, wet season rice and dry season rice. For the purpose of statistical data collection to avoid double counts, the definitions of wet and dry season rice as defined by OAE are given as follows:
Wet – season rice which is sometimes called major rice refers to the rice grown during the wet season which is May to October except in the eastern coast provinces of the southern region, namely, Nakhon Si Thammarat, Phatthalung, Songkhla, Pattani, Yala and Narathiwat where the wet – season rice is grown during 16 June to 28 February of the following year.
Dry – season rice which is sometimes called second rice refers to the rice grown duiring the dry season which is some time between November and April of the following year except in the above 6 provinces which the dry – season rice is grown during 1 March to 15 June. Most of the second rice areas are in the irrigated area in the central plain.
However, the actual rice season can be varied from year to year depending on the weather condition. In irrigated areas, there is no specific season and farmers may grow rice as many as 3 times a year or 5 times in 2 years.
Rice supply chain in Thailand
In general, rice trade in Thailand is a free market system with many buyers and sellers. However, during the 2011 – 2013 period the free market system has collapsed due to the change in government policy by adopting rice pledging scheme which offered very high mortgage prices compared to the market prices. Thus, most of the paddy produced are channeled to the government pledging scheme. The rice mills could not operate efficiently and many of them became storage of the rice stock of the government. The agricultural cooperatives could not collect the paddy from its numbers to carry out their business.
There are four major stages along the rice supply chain in Thailand which include input acquiring, production, paddy distribution and milled rice distribution. The important inputs used in rice production are seeds, fertilizers and chemicals (insecticides and herbicides).For seeds, most farmers obtained seeds from seed dealers in the local areas. However, some farmers use their own seeds produced by themselves on farms. The use of their own seeds which is now very limited due to the change in harvesting method from manual to combine machine. Community Rice Centers (CRC) which produced seeds for farmers by farmers are also another seed providers in the community. For fertilizers and chemicals, most farmers buy from local dealers which sometimes also give some technical advice and credit to their customers.
Right after harvest, farmers may sell their paddies to the local assemblers or sometimes mobile (ad hoc) assemblers which usually come from other provinces during the peak of the harvesting period. Some farmers may sell it directly to the rice mills in the nearby areas. This is because most of the rice farmers have no drying facilities and no storage. However, some famers may keep some of their paddies for household consumption and for seeds in the next season. The paddies that the farmers kept for household consumption will be milled by small rice mills in the village when it is needed.
After the paddy is milled, most of the millers sell their milled rice to rice exporters through rice brokers. Generally, the big buyers such as exporters and wholesalers will ask the broker to collect milled rice which specify the quantity and the quality (grade) of rice for them. Besides collecting rice, the brokers will also provide credit to buyers by advancing some or all of the amount of money required to buy rice from the millers. In return, brokers will receive a commission about 0.6 – 0.75 % from buyers for their services. For some millers, which have full facilities such as color sorter and packaging machines, they may sell rice directly to buyers such as wholesalers, exporters and oversea importers.
For the domestic market, the milled rice is usually distributed via the wholesalers who bought rice from rice millers and sell it to the retailers around the country and to the modern trade stores or supermarkets as a small rice pack (mainly 5 kg/pack). Some of the milled rice are sold to the rice processing industries for further processing activities to make food and non-food products and sell it in both domestic and oversea markets. However, the secondary or sophisticated rice products are still produced in limited amount compared to the primary products such as regular milled rice. The current rice supply chain in Thailand is shown in Fig. 7.
Fig. 7. Rice supply chain in Thailand
The market structure and flow of rice in Thailand is very dynamic because of the many changes in government policies such as change from income warrantee scheme to pledging scheme due to the change in political party which controlled the government administration. The paddy central markets are no longer in existence and the future market is not anymore active in the trading of rice.
CURRENT AGRICULTURAL POLICES OF MOAC
The current policies of the Ministry of Agricultural and Cooperatives (MOAC) that are related to the high value products development can be summarized as follows.
Production policies
1) Establish the restructuring plan in order to reduce the over production to match with the demand.
For rice crop, the existing growing areas are classified into two major zones, suitable areas and unsuitable areas. For suitable areas, improvement of efficiency of production and quality of the products will be emphasized. Moreover, the second rice have to be reduced and changed to other cash crops or green manure crops or left idle during the dry season. For unsuitable area, mixed farming or change to other activities will be promoted by providing the farmers with some incentives.
2) Reduce cost of production and improve quality of products.
The appropriate technologies will be transferred to the rice farmers extensively. The good agricultural practices (GAPs) for rice farming are encouraged and certified.
3) Promote value-added products.
The training courses and equipment and other incentives will be provided. The government supports include packaging equipment and branding development.
Marketing policies
Production target will be set up to match with the demand before planting time.
These activities include establishing farmers’ markets in the rural communities, facilitating in price negotiation with the local millers as well as organizing the training courses on how to develop e-market platforms.
Rice for niche markets include organic rice, geographical indication (GI) rice, nutritious rice, colored rice, native varieties rice and rice for food processing industry.
Targets
Approach
The paddy fields of each small farmer in the neighborhood are consolidated to make it look similar to a large farm while the ownership remains unchanged. The objectives of the area-based extension system are to make the promoting target areas to achieve economy of scale in order to increase the bargaining power of farmers. Thus, the cost of production for each small farmer in the area will be reduced while the price received by the farmers will be increased. In doing so, it is also very convenient for government officials to transfer site specific technology to the farmers in the areas and assist them in linking with the buyers. In addition, the area – based approach will facilitate the integration of work among different departments to further improve the efficiency and productivity of rice farming.The farmers’ organization for farmers in the particular large farm will be set up, it’s not yet existing, and the farm manager will be appointed to operate each big farm.
The best practice farm in each district will be selected to be a local learning center for farmers in each commodity which include rice crop.
CONCLUSION AND RECOMMENDATION
Thai rice is very important nationally and globally. It is a major source of export earning for the country and a major source of rice supply to feed the world. However, Thai rice farmers are still very poor compared to other occupations in the agricultural sector. Most of them are small farmers and are very old. It is very clear that the government wanted to promote high value products for export instead of primary products such as milled rice as usual to avoid competition from other exporting countries. In practice, however, the action taken by the government to further development and enhancing the secondary products business is very limited especially for small farmers and startup business. More researches and investments by the government in the field of value – added product development are needed. Furthermore, the farmers’ organizations and its network should also be established and strengthened especially in developing and operating high value products business. Agro – tourism should also be promoted for people as consumers to visit rice farms and observe rice cultural practices and value – added activities under the concept “Know producer, Know quality”.
(Submitted as a paper for the International Seminar on “Promoting Rice Farmers’ Market through value-adding Activities”, June 6-7, 2018, Kasetsart University, Thailand)