Introduction
Rice is one of the most important agricultural crops in the Philippines. In fact, one-third of the country’s more than 10 million hectares (ha) of agricultural land is devoted to rice. The average farmer owns 2.0 ha of riceland, and although other agricultural commodities are more profitable to grow than rice, majority would still prefer to grow rice for food security reasons. Many rice-growing families get their staple from their harvest.
Due to the importance of the commodity, rice farming has become one of the most subsidized agricultural sub-sectors. Subsidies are in the form of low interest rates for credit, fertilizers for half their prices, and provision of production and postharvest machineries such as tractors, threshers and dryers to farmer cooperatives and organizations. One of the more important and expensive subsidies for rice is irrigation. This subsidy is extended for almost all types of irrigation systems: irrigation service fees (ISF) based only on the operations and maintenance (O&M) costs for the national irrigation systems (NIS), interest-free amortizations for the communal irrigation systems (CIS), free or subsidized prices for irrigation pumps, and donations/loans for construction of small water impounding systems.
With agricultural lands at the frontier, the only source of productivity from rice farming is from increased yields. Water is very important in increasing yield. Empirical and experimental data have amply demonstrated that yields from irrigated farms are always higher compared to non-irrigated farms. In the Philippines, yield from irrigated rice has been fluctuating, but is generally on the increasing trend from 3.29 tons per ha (t/ha) in 1990 to 3.99 t/ha in 2010 and 4.22 t/ha in 2014 (Table 1). Yields from non-irrigated area, on the other hand, has been consistently lower than these values. This underscores the need for a continuing subsidy for irrigation for rice farms.
The ISF, especially in the NIS, are quite low. Initially, the ISF was set by government based on projected O&M costs. This did not cover the cost of construction of the irrigation infrastructure, nor reflect the scarcity of water. The cost of the subsidy has placed a heavy burden to the budget of the government. It is in this context that the paper analyzed the trends of target and actual collections, as well as the O&M costs under various policy regimes that mandate the ISF rate. Due to data limitations, the analysis is limited to national irrigation systems only.
Irrigation policies
System of irrigation water pricing
Water pricing is the system of assigning monetary value to the irrigation water on users to reflect water cost. According to the Global Water Partnership, as cited by Cornish, et al. (2004), there are three levels of water cost: (1) full supply costs which concerns cost recovery, including capital depreciation, and replacement costs as well as O&M costs; (2) full economic costs which includes the full supply costs in (1) as well as the opportunity costs and the economic externalities; and (3) full cost which covers both (1) and (2) in addition to environmental externalities. Although the concepts are valid, it has been observed that setting numerical values to these levels is a difficult process.
There are several methods and types of irrigation water allocation and pricing policies which are adopted in various countries. These include flat rate or area-based charge, marginal cost pricing, average cost pricing, volumetric pricing, crop-based, tradeable rights and ability to pay principle.
Irrigation fees that are based on flat rates or area based charge aim to recover costs. Flat rates or area-based schemes charge irrigation fees, in cash or in kind, based on the area of the farm. These charges are fixed per area, for instance 2 cavans per ha or PHP 2,000 per ha. They are simple to administer but do not provide any incentive for the farmers to use water efficiently. In the Philippines, most farms in the NIS practice continuous flooding of rice fields, from land preparation until a month before harvesting. David (2004) estimated that in the Philippines, rice fields use 15,000 to 30,000 cubic meter (m3) of water per ha, while other countries use only 7,500 m3. He estimated that the country’s water use efficiency was only 40%. This wasteful use of water contributes also to the degradation of the environment, not only in the form of siltation and sedimentation due to fertilizer use, but to emission of methane that contributes to global warming. IRRI (as cited in IPCC, 1996) has estimated that in the Philippines, methane emission from rice production using continuous flooding system is 2-42 g/ha per season. This greatly contributes to the total methane emission of 60 teragram (Tg) per year from rice production alone. Other countries that adopt area based irrigation water pricing are China (Liao et al., 2008) and India (Veetil et al., 2011).
Marginal cost pricing is used when the objective is allocative efficiency and maximizing net social benefits. The cost is estimated to be the incremental cost of supplying an additional unit of water. There is, however, difficulty in using marginal cost pricing, especially when defining which cost to use. The cost can be based on the extraction and distribution cost, the inclusion of construction cost, and the environmental costs (which includes user or depletion cost). For instance, estimation of the environmental cost varies depending on the area and source of water. In areas surrounding Laguna Lake, for example, the environmental cost of raw water was valued at PHP4.81, although the cost of surface water was only PHP1.66 (Briones, 2007). The Asian Development Bank (ADB), one of the creditor banks funding some of the irrigation projects in the country, proposed the possibility of marginal cost pricing for NIS. Marginal cost pricing, however, will be difficult to implement given the existing irrigation structure and design of NIS.
Volumetric pricing or volume-based pricing is a system where a fixed rate per unit of water is charged in a variable rate depending on the volume, that is, lower rate for lower volume, and higher rate for higher water volume used. This kind of system is used in Israel (Tsur, 2005), Australia (Appels et al., 2004) Spain (Gomez-Limon, 2000) and China (Liao et al., 2008).
Average cost pricing aims at recovering all costs by charging for each unit according to the average cost of providing all inputs. This method is simple, easy to understand, fair and equitable since the price paid refers only to the resource costs incurred (Pabuayon, 2011). To a certain extent, the pricing of irrigation water from CIS uses this concept. Farmers pay the equivalent amount of amortization for the construction of the irrigation infrastructure, computed without interest for a period of 50 years (NIA, 2016). Farmers have the responsibility for the operations and maintenance cost of the system. After full payment, the system is completely turned over to the farmers’ organizations.
The ability to pay principle is based on equity. The basis of setting water rates is the income and wealth of users rather than the costs. This scheme is commonly adopted in the developed countries, such as in the United States and Europe, where irrigation is for a number of crops, not only for rice.
Other methods include crop-based, which is a variable rate per unit area depending on the crops planted. Using this method, water charges are not related to the volume used. This is used in India (Barton, 2009) and Spain (Gomez-Limon, 2000). Another less common scheme is the tradeable water rights, where rights of holders of irrigation water may be sold according to some specified rules such as in Australia (Appels et al., 2004).
Irrigation system in the Philippines
In the Philippines, there are three types of irrigation systems: the National Irrigation System, the Communal Irrigation System, and the Private Irrigation Systems.
The NIS are large and medium infrastructure operated and maintained by the National Irrigation Administration (NIA). Water users are organized into irrigators’ associations who are also tasked to jointly manage portions of the irrigation canals (NIA, 2016). Through the years, the NIS provides irrigation to around 50% of the country’s total irrigable area (Table 1). The NIS service area has been increasing from 663,209 ha in 1990 to 767,006 in 2010, but slightly decreased to 750,169 in 2014. The largest NIS derives irrigation water from large multipurpose storage of water. The Magat River Integrated Irrigation System in the Cagayan Valley Region and the Upper Pampanga River Integrated Irrigation System in the Central Luzon Region together serve more than 200,000 ha, while the Angat-Maasim, although primarily for urban water supply, also serves 31,500 ha of irrigation area. These three large irrigation systems are found in the island of Luzon. The remaining 175 NISs distributed throughout the country, serve more than 460,000 ha or 69% of the service area (NIA, 2016). These are mainly run-of-the-river diversion systems. NIA charges users ISF to cover the cost of operation and maintenance of the system.
The CIS total service area decreased in the late 1990s but has been steadily increasing. Individually, a CIS has a service area of less than 1,000 ha. In 1997, about 4,925 CISs serve 491,360 ha or 36% of the total irrigation service area; in 2014, the area served increased to around 595,693 ha. These are mainly run-of-the-river gravity diversion systems, although there are also some pumped schemes. NIA builds ClSs, and transfers these to irrigators’ associations which are responsible for O&M on completion. Farmers are responsible for O&M of the systems and are not charged ISFs but are required to contribute to investment costs. Ownership of communal systems is transferred to irrigators’ associations on completion of the amortization payment. As stipulated in the Local Government Code of 1991, CISs have been devolved to local government units from NIA.
The area served by private irrigation system is also steadily increasing from 152,128 ha in 1990 to 194,841 in 2014. The private irrigation systems consist of small water impoundments, shallow tube wells, and irrigation pumps that are privately owned.
Table 1. Total irrigated area by type of irrigation system in the Philippines and yield of rice, 1990-2014.
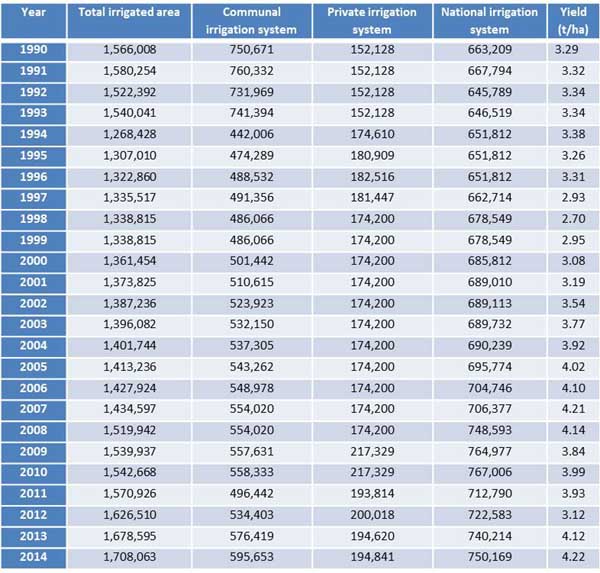
Source: Philippine Statistics Authority, 2016 (Countrystat).
Government policies on irrigation service fees
Republic Act 3601: An Act Creating the National Irrigation Administration
The National Irrigation Administration (NIA) was established under Republic Act (RA) No. 3601 in June 1964 as a government-owned and controlled corporation mandated to develop, improve, operate, and maintain irrigation systems throughout the Philippines. Initially lodged under the Office of the President, the agency was later transferred to the Department of Public Works, Transportation, and Communications in 1972, then to the Department of Public Works and Highways and Department of Agriculture (DA) in 1987. In 1992, it was transferred wholly to DA, emphasizing the Department's role in agricultural development and food security (Small, 1986).
Presidential Decree No. 552: Amending Certain Sections of RA 3601
Presidential Decree (PD) No. 552 of 1974 amends RA 3601. Under PD 552, NIA is mandated to charge and collect from the beneficiaries of the irrigation systems constructed by or under NIA's administration, such fees or administration charges as may be necessary to the O&M costs, and to recover the costs of construction within a reasonable period of time to the extent consistent with government policy. However, to date, NIA has not collected any fee for the recovery of the cost of construction of any NIS. Initially NIA operated as a government agency funded by the national budget. In 1974, a major change of charter required that NIA to become financially independent. The agency was allowed to retain revenues from ISF collections and equipment rentals. By 1979, it had achieved overall financial viability, a status maintained until the late 1980s (ADB, 2000).
The national policy on the repayment of the costs of irrigation facilities is embodied in the National Economic and Development Authority Resolution No. 20, Series of 1978 (Small, 1986). The resolution allows NIA to impose charges to generate revenues sufficient to cover only O&M costs of such facilities and to recover within a period of no longer than 50 years, the money initially invested in such facilities; provided that such charges shall not impair the users incentive to avail of the benefits from irrigation and provided further that the Government shall bear the cost of interest on all indebtedness incurred for the development of irrigation facilities particularly those for areas devoted to the production of rice, corn and feed grains, and vegetables.
Under this legal mandate, the ISF rates for NIS is given in Table 2:
Table 2. Irrigation service fee rates in the NIS under RA 3601 and PD 552.
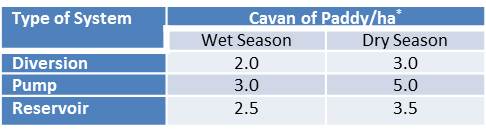
Source: Raby, 1998
*(one cavan = 50 kg)
The ISF is denominated in palay[3], hence farmers may pay either in cash or in kind based on the government paddy support price. The denomination in palay is supposed to provide a degree of indexation against inflation. In the 1990s, about 50% of farmers paid in cash. NIA lost about 10-15% of its gross recipes in collecting, storing, and selling paddy. Unpaid ISF becomes liens[4], first on the land benefitted and then on the crops planted. Such a lien has preference over all other liens, except for taxes on the land.
Administrative Order (AO) 17 of 1998: Adoption of a Socialized Irrigation Service Fee, Communal Irrigation Systems Amortization Rates, and Other Urgent Interim Measures to Cushion the Effects of El Niño and the Asian Currency Crisis in the Agricultural Sector, Particularly to Benefit Irrigation Farmer Beneficiaries
In 1997 to 1998, the Philippines was affected by a prolonged drought due to the El Niño phenomenon. The lack of rainfall in 1997 resulted in crop production losses for wet season rice and corn crops. As a consequence, the area programmed for irrigation by the NlSs was reduced by nearly 8% in 1998. Needless to say, total production of rice and corn was reduced by 12.7% in 1997and 8.7% in 1998.
To mitigate the combined effects of the drought on agriculture, which was then coupled by the Asian financial crisis in 1997, then President Joseph Estrada issued Administrative Order (AO) 17 on 31 August 1998, concerning the so-called Socialized 1SF, an urgent interim measure to provide relief to small-scale farmers. It stipulated that (i) farmers owning less than 2.0 ha of irrigated farm land will pay only 50% of the former ISF; (ii) farmers owning more than 5.0 ha of irrigated farm land will pay 50% more than the former ISF; (iii) the minimum amortization payment of 75 kilograms (kg) of paddy per year for the communal irrigation system (CIS) is reduced to 50 kg/ha per year with no interest (Table 3).
Under this payment scheme, NIA estimated that for the agency to be profitable, it must collect at a rate of 80%, a collection rate that has never been achieved in the past.
Table 3. Socialized irrigation service fee rates in the NIS under AO 17.
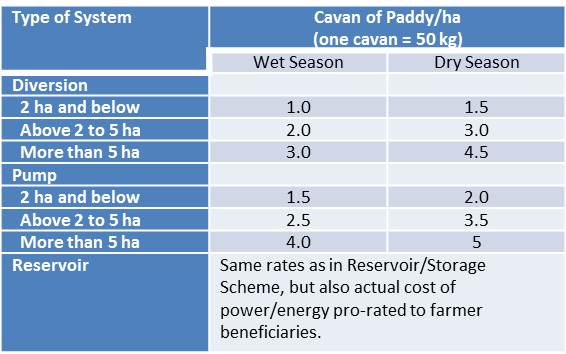
Source: AO 17, 1998.
Executive Order 197: Directing All Departments, Bureaus, Offices and Units, Including Government-owned or Controlled Corporations to Review and Upgrade their Rates and Charges by not Less than 20 percent Source: AO 17, 1998.
In January 2000, the President issued Executive Order (EO) 197. The EO stated that: The revised guidelines shall wherever practicable, be uniform for similar or comparable services and functions and shall be determined by the respective department heads, governing boards, or equivalent functionaries; and in revising fees and charges, units shall be guided by the universal concept of user charges which is to recover at least the full cost of services rendered.
Because the 80% collection rate was not plausible, and due to pressures from the banks that granted the loans for irrigation projects, NIA used EO 197 as legal basis to revert from AO 17 to the old ISF rates as stipulated in Table 2.
Irrigation service fee rates, targets and actual collections, and operations and maintenance costs
This section presents the trends of targets and actual collections of ISF under various policy regimes as well as the O&M costs of maintaining irrigation facilities.
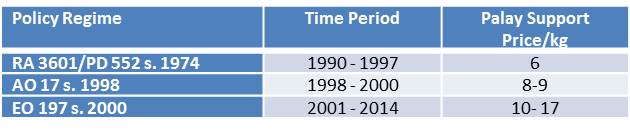
Although ISF as denominated in cavans did not change particularly the first and last policy regimes, their actual peso values varied across the regimes depending on the support price of palay. Table 4 presents the palay support price under the three policy regimes. Under RA 3601/PD 552 representing the period 1990-1997, support price was stable at PHP 6.00/kg, while it was PHP 8.00-9.00/kg in 1998-2000 when AO 17 was implemented. Then when the ISF was reverted back to the RA 3601/PD 552 rates under EO 197, starting 2001, the palay support price ranged from PHP 10.00 to PHP 17.00 per kilogram.
Table 4. Palay support price during the three irrigation policy regimes.
Through the years, NIA’s collection rate for the ISF in the NIS has always been low for the current accounts, or the accounts that are due on the same year. The collection rate improves when collection of back accounts are taken into consideration. According to ADB (2000), however, the collection rates with backlog accounts had not exceeded 70%. Due to the complicated and unavailable time series data involving backlog accounts, this analysis will be limited to current year accounts.
From the records culled from various NIA consultant reports, annual reports, and BAS CountryStat data on NIS area, the target collection based on the NFA palay support price and the per ha ISF of 5.0 cavans per year (or an average of 2.5 cavans per season, with two seasons per year), as well as the collection rate based on the actual collection from 1990 to 2014 are compiled in Table 5.
Table 5. Irrigation service fees target and actual collections, collection rates and operations and management costs of the Philippine National Irrigation Systems, 1990-2014.
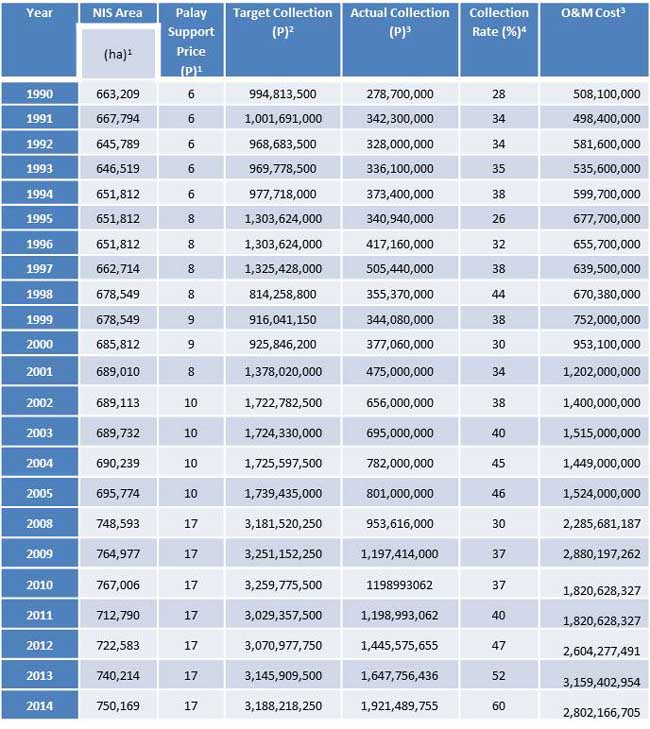
No data for 2006 and 2007
1 Source: Philippine Statistics Authority, 2016
2 Source: Author’s Calculations - NIS Area x ISF per hectare (5 cav/year) X palay support price
3 Source: NIA Annual Reports, various years; O&M costs includes salaries of NIA personnel.
4 Source: Author’s Calculations - Actual collection/target collection x 100
With the increasing NIS service area and the increasing palay support price, the trend for target collection was increasing over the years, reaching up to PHP 3.2 B in 2009 (Fig. 1). The second policy regime saw a decrease in the targeted collection, as this was the period were the ISF was reduced following the socialized scheme. The third policy regime saw a sudden increase, particularly in 2005-2008 because of the change in palay support price, triggered perhaps in part by the global food crisis in 2008.
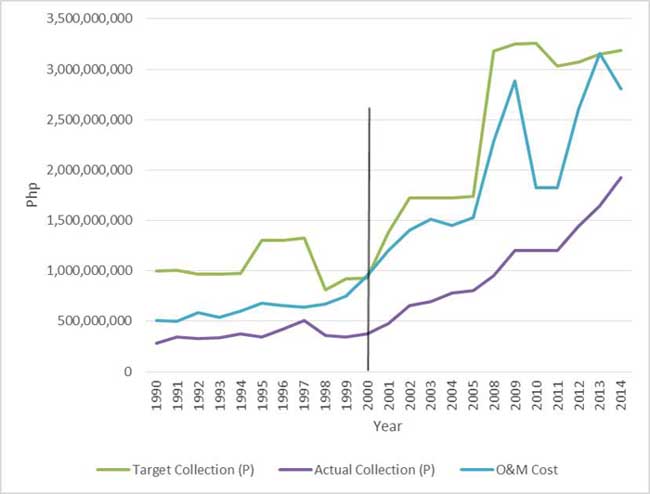
Figure 1. Target and actual irrigation service fees and operation and maintenance cost, National Irrigation Systems, Philippines, 1990-2014
ISF actual collection has historically been way below the target collection. Even with the revenues generated from the CIS and other incomes, NIA has been reportedly operating at a loss (Raby, 1998). According to Raby (1998), ISF collection has been limited despite NIAs efforts to improve the O&M standards because farmers do not believe that the fees are justified because (1) the beneficiaries were not involved in the design and implementation; and (2) poor distribution networks at the farm level, resulting in high water losses.
The operating and maintenance costs are also analyzed in relation to the collected ISF. O&M costs were increasing, reaching up to PHP 2.8 B in 2009 (Table 5 and Figure 1). Historically, more than 75% of the cost goes to personnel expenses (Small, et al., 1986). This was seen to have supposedly changed when NIA has implemented its personnel rationalization plan as required for all government agencies. However in 2013, after the implementation of the rationalization plan, the O&M costs reached PHP 3.1 B but eventually went down again to PHP 2.8 B in 2014.
The data in Table 5 and Fig. 1 show that had all ISF been collected, the O&M cost would have been more than covered, with a net revenue being realized. In fact, there appears to be a very large margin between O&M costs and ISF. According to the World Bank (as cited by Small, et al., 1986), the near absence of any mechanical equipment to maintain the irrigation systems and the lack of physical facilities and discipline to ensure adequate and timely distribution of water to farmers led to NIA losing credibility, hence farmers do not pay.
Analysis based on the various policy regimes for ISFs, however, showed that although the values of actual collection was increasing, average collection rates did not significantly vary. The collection was only about 33% for the original ISF regime, where the average price was only PHP 6.00; about 37% during the Socialized ISF even with the slightly higher average palay price of PHP 8.00-9.00; and 38% during the current ISF regime when palay prices were at its highest. The highest difference in target and actual collection was during the 2001-2014 regime, particularly from 2008 when the price of palay was PHP 17.00 (Table 5).
Comparing O&M cost and actual collections would give an idea of the extent of government subsidy. Fig. 1 again shows that the gap between the O&M costs and the actual collection was increasing through time. Hence, government subsidy for irrigation under NIS has also been increasing.
By policy regime, the difference in the average operations and maintenance costs and actual collection is also increasing, doubling from one regime to another. NIA should therefore exert more effort and look for more ways to increase collection rates to minimize this gap, hence also minimize government subsidy for NIS.
By 1997, NIAs losses went as high as 48%, exceeding total revenues by PHP 81 M. These losses affect the O&M funding, thus government subsidies for NIA operations were very high during these years. The receivables were estimated to be at PHP 15.7 B by the end of 1997. During the same yeardoubtful accounts were estimated to reach PHP 163 M (Raby, 1998; ADB 2000). The losses necessitated deductions in its equity and retained earnings and authorized capital, NIA being a government controlled corporation, making it in danger of going bankrupt.
Correlation analysis was made in an effort to explain why collection rates were very low. Between palay support price and the collection rate, a correlation coefficient of 0.14 means that although the palay support price affects the payment decisions of farmers, they do so at a less degree only. However, correlation coefficient between actual collection in Table 5 and yield found in Table 1 is high at 0.7, which means that farmers pay more when harvest is good. This is consistent with human behaviour. The reason why there was still low average collection rate during the socialized ISF was may be due to the low yields as a result of the drought. It must be noted that El Niño was the primary reason why the ISF was changed anyway.
The per hectare O&M and ISF collection, the extent of net revenues for NIA, or in this case, the losses incurred, and the prospective margin as percent of the ISF is summarized in Table 6. As also shown in Figure 1, the average collection is only half of the O&M cost.
Table 6. ISF collection and O&M cost per hectare, by ISF regime.
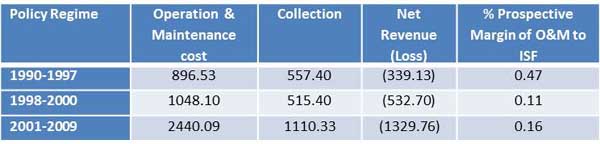
Source: Author’s computations based on Table 5.
The difference between the ISF and O&M cost or the margin, changes depending on the value of the ISF which, as already discussed, changes depending on the palay support price. Total O&M is increasing, partly because of the increase in hectarage and salary adjustments of NIA personnel. The prospectively high ISF margins of 0.47 in the first regime resulted to a negative net revenues; the low ISF margin of 11% and 16% also resulted to a negative net revenue (Table 6).
CONCLUSION
The Philippine policy for ISF underwent some changes since its promulgation in the 1970s. The first policy that paved the way for the collection of the ISF in the NIS was embodied in RA 3501 in 1964 when the NIA was created, and by PD 552 in 1974 when NIA was mandated to collect ISF, rates of which were spelled out in the PD. The succeeding policy, AO 17 in 1998, revised the rates enumerated in PD 552, effectively reducing the ISF to ease the farmer’s burden due to the drought. Because AO 17 resulted to a very low ISF collection, NIA used EO 197 issued in 2000 to revert back to the rates of PD 552. The ISF rates, which are denominated in palay, have undergone changes in terms of actual monetary values, as the palay support price changed from PHP 6.00/kg to PHP 17.00/kg in the recent years. Other than these, there has been no updating of the ISF rates in the NIS.
Based on the preceding discussion, it may be concluded that the various ISF rates do not have any effect on the payment behaviour of farmers and the actual collection rates. High and low ISF rates result to a collection rate that is less than 40%. This rate is not enough to cover even the O&M costs of the NIS service area. Studies have been conducted analyzing the reason for this farmer behaviour, and the actual value of the ISF has changed over time. NIA, however, is still not successful in recovering its O&M costs. The analysis on the per hectare O&M costs, ISF, collection and margins showed that the actual ISF, if paid in full, is enough to cover the O&M costs. Improving collection would reduce the difference between O&M cost and collection, thereby reducing government subsidy for irrigation under NIS.
Non-payment of ISF has sanctions as mentioned in the earlier part of the paper. Unpaid ISF becomes liens, first on the land benefitted and then on the crops planted. Such a lien has preference over all other liens, except for taxes on the land. A lien is a legal claim of a person upon the property of another to secure payment of a debt or the satisfaction of an obligation. It may be high time for NIA to fully implement this provision. If collection is strictly done and the lien imposed, NIA will be able to function as a government corporation that is at least financially independent, if not earning a little. This will unburden the government from the annual appropriations for NIA that constitutes as subsidy for the farmers. This high subsidy for irrigation has always been taken for granted. However, this can be done only if NIA also addresses issues on performance, including maintenance of canals, among others.
References
Administrative Order No. 17. 1998. Adoption of a Socialized Irrigation Service Fee, Communcal Irrigation Systems (CIS) Amortization Rates and Other Urgent Interim Measures to Cushion the Effects of El Nino and the Asian Currency Crisis inthe Agricultural Sector, Particularly to Benefit Irrigation Farmer Beneficiaries. Malacanang, Philippines.
Asian Development Bank. 2000. Technical Assistance to the Republic of the Philippines for the Review of Cost Recovery Mechanisms for National Irrigation Systems. ADB Report, Manila, Philippines.
Briones, N. 2007. Pricing Laguna Lakes Raw Surface Water for Domestic Water Supply in Metro Manila. SEARCA Professorial Chair Lecture. December 12, 2007. University of the Philippines Los Banos, Laguna, Philippines.
David, W. 2004. Water Resources and Irrigation Policy Issues in Asia. Asian Journal of Agriculture and Development, Vol. 1, No. 1, June 2004.
Executive Order No. 197. 2000. Directing All Departments, Bureaus, Commissions, Agencies, Offices and Instrumentalities of the National Government, Including Government-Owned or Controlled Corporations, to Increase Their Rates of Fees and Charges by Not Less Than 20%. Malacanang, Philipines.
Intergovernmental Panel on Climate Change. 1996. Methane Emissions from Rice Cultivation: Flooded Rice Fields. In: IPCC Guidelines for National Greenhouse Gas Inventories: Reference Manual. IPCC, Japan.
International Rice Research Institute. 2011. Accessed on September 10, 2011, from http://irri.org/
National Irrigation Administration. 2010. 2009 NIA Annual Report. Quezon City, Philippines. Accessed in February 2016, from http://www.nia.gov.ph/
National Irrigation Administration. 2006. 2005 NIA Annual Report. Quezon City, Philippines. Accessed in February 2016, from http://www.nia.gov.ph/
Philippine Statistics Authority (PSA). CountryStat database. Accessed in February 2016, from https://www.psa.gov.ph/
Raby, N. 1999. Participatory Irrigation Management in the Philippines: National Irrigation Systems. In EDI Participatory Irrigation Management Case Studies Series. International Network on Participatory Irrigation Management. Washington DC. USA.
Rivera, M., et al. 2000. Inventory of Users of Surface Water and Water Resource Pricing. Terminal Report. Ecosystems Research and Development Bureau, Los Banos, Laguna, Philippines.
Small, L., Adriano, M. And Martin, E. 1986. Financing Irrigation Services in the Philippines. Terminal Report. IWMI.
[1] Policy paper submitted to the Food and Fertilizer Technology Center (FFTC) for the project titled “Asia-Pacific Information Platform in Agricultural Policy”. Policy papers, as corollary outputs of the project, describe pertinent Philippine laws and regulations on agriculture, aquatic and natural resources.
[2] Senior Science Research Specialist, Socio-Economics Research Division-Philippine Council for Agriculture, Aquatic and Natural Resources Research and Development (SERD-PCAARRD) of the Department of Science and Technology (DOST), Los Baños, Laguna, Philippines.
[3] Palay is the local term for unmilled rice in the Philippines.
[4] A lien is a legal claim of a person upon the property of another to secure payment of a debt or the satisfaction of an obligation (www.dictionary.com)
|
Date submitted: Feb. 26, 2016
Reviewed, edited and uploaded: Feb. 26, 2016
|
|

Analysis of the Effects of Various Irrigation Service Fees for National Irrigation Systems in the Philippines
Introduction
Rice is one of the most important agricultural crops in the Philippines. In fact, one-third of the country’s more than 10 million hectares (ha) of agricultural land is devoted to rice. The average farmer owns 2.0 ha of riceland, and although other agricultural commodities are more profitable to grow than rice, majority would still prefer to grow rice for food security reasons. Many rice-growing families get their staple from their harvest.
Due to the importance of the commodity, rice farming has become one of the most subsidized agricultural sub-sectors. Subsidies are in the form of low interest rates for credit, fertilizers for half their prices, and provision of production and postharvest machineries such as tractors, threshers and dryers to farmer cooperatives and organizations. One of the more important and expensive subsidies for rice is irrigation. This subsidy is extended for almost all types of irrigation systems: irrigation service fees (ISF) based only on the operations and maintenance (O&M) costs for the national irrigation systems (NIS), interest-free amortizations for the communal irrigation systems (CIS), free or subsidized prices for irrigation pumps, and donations/loans for construction of small water impounding systems.
With agricultural lands at the frontier, the only source of productivity from rice farming is from increased yields. Water is very important in increasing yield. Empirical and experimental data have amply demonstrated that yields from irrigated farms are always higher compared to non-irrigated farms. In the Philippines, yield from irrigated rice has been fluctuating, but is generally on the increasing trend from 3.29 tons per ha (t/ha) in 1990 to 3.99 t/ha in 2010 and 4.22 t/ha in 2014 (Table 1). Yields from non-irrigated area, on the other hand, has been consistently lower than these values. This underscores the need for a continuing subsidy for irrigation for rice farms.
The ISF, especially in the NIS, are quite low. Initially, the ISF was set by government based on projected O&M costs. This did not cover the cost of construction of the irrigation infrastructure, nor reflect the scarcity of water. The cost of the subsidy has placed a heavy burden to the budget of the government. It is in this context that the paper analyzed the trends of target and actual collections, as well as the O&M costs under various policy regimes that mandate the ISF rate. Due to data limitations, the analysis is limited to national irrigation systems only.
Irrigation policies
System of irrigation water pricing
Water pricing is the system of assigning monetary value to the irrigation water on users to reflect water cost. According to the Global Water Partnership, as cited by Cornish, et al. (2004), there are three levels of water cost: (1) full supply costs which concerns cost recovery, including capital depreciation, and replacement costs as well as O&M costs; (2) full economic costs which includes the full supply costs in (1) as well as the opportunity costs and the economic externalities; and (3) full cost which covers both (1) and (2) in addition to environmental externalities. Although the concepts are valid, it has been observed that setting numerical values to these levels is a difficult process.
There are several methods and types of irrigation water allocation and pricing policies which are adopted in various countries. These include flat rate or area-based charge, marginal cost pricing, average cost pricing, volumetric pricing, crop-based, tradeable rights and ability to pay principle.
Irrigation fees that are based on flat rates or area based charge aim to recover costs. Flat rates or area-based schemes charge irrigation fees, in cash or in kind, based on the area of the farm. These charges are fixed per area, for instance 2 cavans per ha or PHP 2,000 per ha. They are simple to administer but do not provide any incentive for the farmers to use water efficiently. In the Philippines, most farms in the NIS practice continuous flooding of rice fields, from land preparation until a month before harvesting. David (2004) estimated that in the Philippines, rice fields use 15,000 to 30,000 cubic meter (m3) of water per ha, while other countries use only 7,500 m3. He estimated that the country’s water use efficiency was only 40%. This wasteful use of water contributes also to the degradation of the environment, not only in the form of siltation and sedimentation due to fertilizer use, but to emission of methane that contributes to global warming. IRRI (as cited in IPCC, 1996) has estimated that in the Philippines, methane emission from rice production using continuous flooding system is 2-42 g/ha per season. This greatly contributes to the total methane emission of 60 teragram (Tg) per year from rice production alone. Other countries that adopt area based irrigation water pricing are China (Liao et al., 2008) and India (Veetil et al., 2011).
Marginal cost pricing is used when the objective is allocative efficiency and maximizing net social benefits. The cost is estimated to be the incremental cost of supplying an additional unit of water. There is, however, difficulty in using marginal cost pricing, especially when defining which cost to use. The cost can be based on the extraction and distribution cost, the inclusion of construction cost, and the environmental costs (which includes user or depletion cost). For instance, estimation of the environmental cost varies depending on the area and source of water. In areas surrounding Laguna Lake, for example, the environmental cost of raw water was valued at PHP4.81, although the cost of surface water was only PHP1.66 (Briones, 2007). The Asian Development Bank (ADB), one of the creditor banks funding some of the irrigation projects in the country, proposed the possibility of marginal cost pricing for NIS. Marginal cost pricing, however, will be difficult to implement given the existing irrigation structure and design of NIS.
Volumetric pricing or volume-based pricing is a system where a fixed rate per unit of water is charged in a variable rate depending on the volume, that is, lower rate for lower volume, and higher rate for higher water volume used. This kind of system is used in Israel (Tsur, 2005), Australia (Appels et al., 2004) Spain (Gomez-Limon, 2000) and China (Liao et al., 2008).
Average cost pricing aims at recovering all costs by charging for each unit according to the average cost of providing all inputs. This method is simple, easy to understand, fair and equitable since the price paid refers only to the resource costs incurred (Pabuayon, 2011). To a certain extent, the pricing of irrigation water from CIS uses this concept. Farmers pay the equivalent amount of amortization for the construction of the irrigation infrastructure, computed without interest for a period of 50 years (NIA, 2016). Farmers have the responsibility for the operations and maintenance cost of the system. After full payment, the system is completely turned over to the farmers’ organizations.
The ability to pay principle is based on equity. The basis of setting water rates is the income and wealth of users rather than the costs. This scheme is commonly adopted in the developed countries, such as in the United States and Europe, where irrigation is for a number of crops, not only for rice.
Other methods include crop-based, which is a variable rate per unit area depending on the crops planted. Using this method, water charges are not related to the volume used. This is used in India (Barton, 2009) and Spain (Gomez-Limon, 2000). Another less common scheme is the tradeable water rights, where rights of holders of irrigation water may be sold according to some specified rules such as in Australia (Appels et al., 2004).
Irrigation system in the Philippines
In the Philippines, there are three types of irrigation systems: the National Irrigation System, the Communal Irrigation System, and the Private Irrigation Systems.
The NIS are large and medium infrastructure operated and maintained by the National Irrigation Administration (NIA). Water users are organized into irrigators’ associations who are also tasked to jointly manage portions of the irrigation canals (NIA, 2016). Through the years, the NIS provides irrigation to around 50% of the country’s total irrigable area (Table 1). The NIS service area has been increasing from 663,209 ha in 1990 to 767,006 in 2010, but slightly decreased to 750,169 in 2014. The largest NIS derives irrigation water from large multipurpose storage of water. The Magat River Integrated Irrigation System in the Cagayan Valley Region and the Upper Pampanga River Integrated Irrigation System in the Central Luzon Region together serve more than 200,000 ha, while the Angat-Maasim, although primarily for urban water supply, also serves 31,500 ha of irrigation area. These three large irrigation systems are found in the island of Luzon. The remaining 175 NISs distributed throughout the country, serve more than 460,000 ha or 69% of the service area (NIA, 2016). These are mainly run-of-the-river diversion systems. NIA charges users ISF to cover the cost of operation and maintenance of the system.
The CIS total service area decreased in the late 1990s but has been steadily increasing. Individually, a CIS has a service area of less than 1,000 ha. In 1997, about 4,925 CISs serve 491,360 ha or 36% of the total irrigation service area; in 2014, the area served increased to around 595,693 ha. These are mainly run-of-the-river gravity diversion systems, although there are also some pumped schemes. NIA builds ClSs, and transfers these to irrigators’ associations which are responsible for O&M on completion. Farmers are responsible for O&M of the systems and are not charged ISFs but are required to contribute to investment costs. Ownership of communal systems is transferred to irrigators’ associations on completion of the amortization payment. As stipulated in the Local Government Code of 1991, CISs have been devolved to local government units from NIA.
The area served by private irrigation system is also steadily increasing from 152,128 ha in 1990 to 194,841 in 2014. The private irrigation systems consist of small water impoundments, shallow tube wells, and irrigation pumps that are privately owned.
Table 1. Total irrigated area by type of irrigation system in the Philippines and yield of rice, 1990-2014.
Source: Philippine Statistics Authority, 2016 (Countrystat).
Government policies on irrigation service fees
Republic Act 3601: An Act Creating the National Irrigation Administration
The National Irrigation Administration (NIA) was established under Republic Act (RA) No. 3601 in June 1964 as a government-owned and controlled corporation mandated to develop, improve, operate, and maintain irrigation systems throughout the Philippines. Initially lodged under the Office of the President, the agency was later transferred to the Department of Public Works, Transportation, and Communications in 1972, then to the Department of Public Works and Highways and Department of Agriculture (DA) in 1987. In 1992, it was transferred wholly to DA, emphasizing the Department's role in agricultural development and food security (Small, 1986).
Presidential Decree No. 552: Amending Certain Sections of RA 3601
Presidential Decree (PD) No. 552 of 1974 amends RA 3601. Under PD 552, NIA is mandated to charge and collect from the beneficiaries of the irrigation systems constructed by or under NIA's administration, such fees or administration charges as may be necessary to the O&M costs, and to recover the costs of construction within a reasonable period of time to the extent consistent with government policy. However, to date, NIA has not collected any fee for the recovery of the cost of construction of any NIS. Initially NIA operated as a government agency funded by the national budget. In 1974, a major change of charter required that NIA to become financially independent. The agency was allowed to retain revenues from ISF collections and equipment rentals. By 1979, it had achieved overall financial viability, a status maintained until the late 1980s (ADB, 2000).
The national policy on the repayment of the costs of irrigation facilities is embodied in the National Economic and Development Authority Resolution No. 20, Series of 1978 (Small, 1986). The resolution allows NIA to impose charges to generate revenues sufficient to cover only O&M costs of such facilities and to recover within a period of no longer than 50 years, the money initially invested in such facilities; provided that such charges shall not impair the users incentive to avail of the benefits from irrigation and provided further that the Government shall bear the cost of interest on all indebtedness incurred for the development of irrigation facilities particularly those for areas devoted to the production of rice, corn and feed grains, and vegetables.
Under this legal mandate, the ISF rates for NIS is given in Table 2:
Table 2. Irrigation service fee rates in the NIS under RA 3601 and PD 552.
Source: Raby, 1998
*(one cavan = 50 kg)
The ISF is denominated in palay[3], hence farmers may pay either in cash or in kind based on the government paddy support price. The denomination in palay is supposed to provide a degree of indexation against inflation. In the 1990s, about 50% of farmers paid in cash. NIA lost about 10-15% of its gross recipes in collecting, storing, and selling paddy. Unpaid ISF becomes liens[4], first on the land benefitted and then on the crops planted. Such a lien has preference over all other liens, except for taxes on the land.
Administrative Order (AO) 17 of 1998: Adoption of a Socialized Irrigation Service Fee, Communal Irrigation Systems Amortization Rates, and Other Urgent Interim Measures to Cushion the Effects of El Niño and the Asian Currency Crisis in the Agricultural Sector, Particularly to Benefit Irrigation Farmer Beneficiaries
In 1997 to 1998, the Philippines was affected by a prolonged drought due to the El Niño phenomenon. The lack of rainfall in 1997 resulted in crop production losses for wet season rice and corn crops. As a consequence, the area programmed for irrigation by the NlSs was reduced by nearly 8% in 1998. Needless to say, total production of rice and corn was reduced by 12.7% in 1997and 8.7% in 1998.
To mitigate the combined effects of the drought on agriculture, which was then coupled by the Asian financial crisis in 1997, then President Joseph Estrada issued Administrative Order (AO) 17 on 31 August 1998, concerning the so-called Socialized 1SF, an urgent interim measure to provide relief to small-scale farmers. It stipulated that (i) farmers owning less than 2.0 ha of irrigated farm land will pay only 50% of the former ISF; (ii) farmers owning more than 5.0 ha of irrigated farm land will pay 50% more than the former ISF; (iii) the minimum amortization payment of 75 kilograms (kg) of paddy per year for the communal irrigation system (CIS) is reduced to 50 kg/ha per year with no interest (Table 3).
Under this payment scheme, NIA estimated that for the agency to be profitable, it must collect at a rate of 80%, a collection rate that has never been achieved in the past.
Table 3. Socialized irrigation service fee rates in the NIS under AO 17.
Source: AO 17, 1998.
Executive Order 197: Directing All Departments, Bureaus, Offices and Units, Including Government-owned or Controlled Corporations to Review and Upgrade their Rates and Charges by not Less than 20 percent Source: AO 17, 1998.
In January 2000, the President issued Executive Order (EO) 197. The EO stated that: The revised guidelines shall wherever practicable, be uniform for similar or comparable services and functions and shall be determined by the respective department heads, governing boards, or equivalent functionaries; and in revising fees and charges, units shall be guided by the universal concept of user charges which is to recover at least the full cost of services rendered.
Because the 80% collection rate was not plausible, and due to pressures from the banks that granted the loans for irrigation projects, NIA used EO 197 as legal basis to revert from AO 17 to the old ISF rates as stipulated in Table 2.
Irrigation service fee rates, targets and actual collections, and operations and maintenance costs
This section presents the trends of targets and actual collections of ISF under various policy regimes as well as the O&M costs of maintaining irrigation facilities.
Although ISF as denominated in cavans did not change particularly the first and last policy regimes, their actual peso values varied across the regimes depending on the support price of palay. Table 4 presents the palay support price under the three policy regimes. Under RA 3601/PD 552 representing the period 1990-1997, support price was stable at PHP 6.00/kg, while it was PHP 8.00-9.00/kg in 1998-2000 when AO 17 was implemented. Then when the ISF was reverted back to the RA 3601/PD 552 rates under EO 197, starting 2001, the palay support price ranged from PHP 10.00 to PHP 17.00 per kilogram.
Table 4. Palay support price during the three irrigation policy regimes.
Through the years, NIA’s collection rate for the ISF in the NIS has always been low for the current accounts, or the accounts that are due on the same year. The collection rate improves when collection of back accounts are taken into consideration. According to ADB (2000), however, the collection rates with backlog accounts had not exceeded 70%. Due to the complicated and unavailable time series data involving backlog accounts, this analysis will be limited to current year accounts.
From the records culled from various NIA consultant reports, annual reports, and BAS CountryStat data on NIS area, the target collection based on the NFA palay support price and the per ha ISF of 5.0 cavans per year (or an average of 2.5 cavans per season, with two seasons per year), as well as the collection rate based on the actual collection from 1990 to 2014 are compiled in Table 5.
Table 5. Irrigation service fees target and actual collections, collection rates and operations and management costs of the Philippine National Irrigation Systems, 1990-2014.
No data for 2006 and 2007
1 Source: Philippine Statistics Authority, 2016
2 Source: Author’s Calculations - NIS Area x ISF per hectare (5 cav/year) X palay support price
3 Source: NIA Annual Reports, various years; O&M costs includes salaries of NIA personnel.
4 Source: Author’s Calculations - Actual collection/target collection x 100
With the increasing NIS service area and the increasing palay support price, the trend for target collection was increasing over the years, reaching up to PHP 3.2 B in 2009 (Fig. 1). The second policy regime saw a decrease in the targeted collection, as this was the period were the ISF was reduced following the socialized scheme. The third policy regime saw a sudden increase, particularly in 2005-2008 because of the change in palay support price, triggered perhaps in part by the global food crisis in 2008.
Figure 1. Target and actual irrigation service fees and operation and maintenance cost, National Irrigation Systems, Philippines, 1990-2014
ISF actual collection has historically been way below the target collection. Even with the revenues generated from the CIS and other incomes, NIA has been reportedly operating at a loss (Raby, 1998). According to Raby (1998), ISF collection has been limited despite NIAs efforts to improve the O&M standards because farmers do not believe that the fees are justified because (1) the beneficiaries were not involved in the design and implementation; and (2) poor distribution networks at the farm level, resulting in high water losses.
The operating and maintenance costs are also analyzed in relation to the collected ISF. O&M costs were increasing, reaching up to PHP 2.8 B in 2009 (Table 5 and Figure 1). Historically, more than 75% of the cost goes to personnel expenses (Small, et al., 1986). This was seen to have supposedly changed when NIA has implemented its personnel rationalization plan as required for all government agencies. However in 2013, after the implementation of the rationalization plan, the O&M costs reached PHP 3.1 B but eventually went down again to PHP 2.8 B in 2014.
The data in Table 5 and Fig. 1 show that had all ISF been collected, the O&M cost would have been more than covered, with a net revenue being realized. In fact, there appears to be a very large margin between O&M costs and ISF. According to the World Bank (as cited by Small, et al., 1986), the near absence of any mechanical equipment to maintain the irrigation systems and the lack of physical facilities and discipline to ensure adequate and timely distribution of water to farmers led to NIA losing credibility, hence farmers do not pay.
Analysis based on the various policy regimes for ISFs, however, showed that although the values of actual collection was increasing, average collection rates did not significantly vary. The collection was only about 33% for the original ISF regime, where the average price was only PHP 6.00; about 37% during the Socialized ISF even with the slightly higher average palay price of PHP 8.00-9.00; and 38% during the current ISF regime when palay prices were at its highest. The highest difference in target and actual collection was during the 2001-2014 regime, particularly from 2008 when the price of palay was PHP 17.00 (Table 5).
Comparing O&M cost and actual collections would give an idea of the extent of government subsidy. Fig. 1 again shows that the gap between the O&M costs and the actual collection was increasing through time. Hence, government subsidy for irrigation under NIS has also been increasing.
By policy regime, the difference in the average operations and maintenance costs and actual collection is also increasing, doubling from one regime to another. NIA should therefore exert more effort and look for more ways to increase collection rates to minimize this gap, hence also minimize government subsidy for NIS.
By 1997, NIAs losses went as high as 48%, exceeding total revenues by PHP 81 M. These losses affect the O&M funding, thus government subsidies for NIA operations were very high during these years. The receivables were estimated to be at PHP 15.7 B by the end of 1997. During the same yeardoubtful accounts were estimated to reach PHP 163 M (Raby, 1998; ADB 2000). The losses necessitated deductions in its equity and retained earnings and authorized capital, NIA being a government controlled corporation, making it in danger of going bankrupt.
Correlation analysis was made in an effort to explain why collection rates were very low. Between palay support price and the collection rate, a correlation coefficient of 0.14 means that although the palay support price affects the payment decisions of farmers, they do so at a less degree only. However, correlation coefficient between actual collection in Table 5 and yield found in Table 1 is high at 0.7, which means that farmers pay more when harvest is good. This is consistent with human behaviour. The reason why there was still low average collection rate during the socialized ISF was may be due to the low yields as a result of the drought. It must be noted that El Niño was the primary reason why the ISF was changed anyway.
The per hectare O&M and ISF collection, the extent of net revenues for NIA, or in this case, the losses incurred, and the prospective margin as percent of the ISF is summarized in Table 6. As also shown in Figure 1, the average collection is only half of the O&M cost.
Table 6. ISF collection and O&M cost per hectare, by ISF regime.
Source: Author’s computations based on Table 5.
The difference between the ISF and O&M cost or the margin, changes depending on the value of the ISF which, as already discussed, changes depending on the palay support price. Total O&M is increasing, partly because of the increase in hectarage and salary adjustments of NIA personnel. The prospectively high ISF margins of 0.47 in the first regime resulted to a negative net revenues; the low ISF margin of 11% and 16% also resulted to a negative net revenue (Table 6).
CONCLUSION
The Philippine policy for ISF underwent some changes since its promulgation in the 1970s. The first policy that paved the way for the collection of the ISF in the NIS was embodied in RA 3501 in 1964 when the NIA was created, and by PD 552 in 1974 when NIA was mandated to collect ISF, rates of which were spelled out in the PD. The succeeding policy, AO 17 in 1998, revised the rates enumerated in PD 552, effectively reducing the ISF to ease the farmer’s burden due to the drought. Because AO 17 resulted to a very low ISF collection, NIA used EO 197 issued in 2000 to revert back to the rates of PD 552. The ISF rates, which are denominated in palay, have undergone changes in terms of actual monetary values, as the palay support price changed from PHP 6.00/kg to PHP 17.00/kg in the recent years. Other than these, there has been no updating of the ISF rates in the NIS.
Based on the preceding discussion, it may be concluded that the various ISF rates do not have any effect on the payment behaviour of farmers and the actual collection rates. High and low ISF rates result to a collection rate that is less than 40%. This rate is not enough to cover even the O&M costs of the NIS service area. Studies have been conducted analyzing the reason for this farmer behaviour, and the actual value of the ISF has changed over time. NIA, however, is still not successful in recovering its O&M costs. The analysis on the per hectare O&M costs, ISF, collection and margins showed that the actual ISF, if paid in full, is enough to cover the O&M costs. Improving collection would reduce the difference between O&M cost and collection, thereby reducing government subsidy for irrigation under NIS.
Non-payment of ISF has sanctions as mentioned in the earlier part of the paper. Unpaid ISF becomes liens, first on the land benefitted and then on the crops planted. Such a lien has preference over all other liens, except for taxes on the land. A lien is a legal claim of a person upon the property of another to secure payment of a debt or the satisfaction of an obligation. It may be high time for NIA to fully implement this provision. If collection is strictly done and the lien imposed, NIA will be able to function as a government corporation that is at least financially independent, if not earning a little. This will unburden the government from the annual appropriations for NIA that constitutes as subsidy for the farmers. This high subsidy for irrigation has always been taken for granted. However, this can be done only if NIA also addresses issues on performance, including maintenance of canals, among others.
References
Administrative Order No. 17. 1998. Adoption of a Socialized Irrigation Service Fee, Communcal Irrigation Systems (CIS) Amortization Rates and Other Urgent Interim Measures to Cushion the Effects of El Nino and the Asian Currency Crisis inthe Agricultural Sector, Particularly to Benefit Irrigation Farmer Beneficiaries. Malacanang, Philippines.
Asian Development Bank. 2000. Technical Assistance to the Republic of the Philippines for the Review of Cost Recovery Mechanisms for National Irrigation Systems. ADB Report, Manila, Philippines.
Briones, N. 2007. Pricing Laguna Lakes Raw Surface Water for Domestic Water Supply in Metro Manila. SEARCA Professorial Chair Lecture. December 12, 2007. University of the Philippines Los Banos, Laguna, Philippines.
David, W. 2004. Water Resources and Irrigation Policy Issues in Asia. Asian Journal of Agriculture and Development, Vol. 1, No. 1, June 2004.
Executive Order No. 197. 2000. Directing All Departments, Bureaus, Commissions, Agencies, Offices and Instrumentalities of the National Government, Including Government-Owned or Controlled Corporations, to Increase Their Rates of Fees and Charges by Not Less Than 20%. Malacanang, Philipines.
Intergovernmental Panel on Climate Change. 1996. Methane Emissions from Rice Cultivation: Flooded Rice Fields. In: IPCC Guidelines for National Greenhouse Gas Inventories: Reference Manual. IPCC, Japan.
International Rice Research Institute. 2011. Accessed on September 10, 2011, from http://irri.org/
National Irrigation Administration. 2010. 2009 NIA Annual Report. Quezon City, Philippines. Accessed in February 2016, from http://www.nia.gov.ph/
National Irrigation Administration. 2006. 2005 NIA Annual Report. Quezon City, Philippines. Accessed in February 2016, from http://www.nia.gov.ph/
Philippine Statistics Authority (PSA). CountryStat database. Accessed in February 2016, from https://www.psa.gov.ph/
Raby, N. 1999. Participatory Irrigation Management in the Philippines: National Irrigation Systems. In EDI Participatory Irrigation Management Case Studies Series. International Network on Participatory Irrigation Management. Washington DC. USA.
Rivera, M., et al. 2000. Inventory of Users of Surface Water and Water Resource Pricing. Terminal Report. Ecosystems Research and Development Bureau, Los Banos, Laguna, Philippines.
Small, L., Adriano, M. And Martin, E. 1986. Financing Irrigation Services in the Philippines. Terminal Report. IWMI.
[1] Policy paper submitted to the Food and Fertilizer Technology Center (FFTC) for the project titled “Asia-Pacific Information Platform in Agricultural Policy”. Policy papers, as corollary outputs of the project, describe pertinent Philippine laws and regulations on agriculture, aquatic and natural resources.
[2] Senior Science Research Specialist, Socio-Economics Research Division-Philippine Council for Agriculture, Aquatic and Natural Resources Research and Development (SERD-PCAARRD) of the Department of Science and Technology (DOST), Los Baños, Laguna, Philippines.
[3] Palay is the local term for unmilled rice in the Philippines.
[4] A lien is a legal claim of a person upon the property of another to secure payment of a debt or the satisfaction of an obligation (www.dictionary.com)
Date submitted: Feb. 26, 2016
Reviewed, edited and uploaded: Feb. 26, 2016