Yoshihisa GODO
Professor, Meiji Gakuin University, Japan
1. Definition of “agricultural labor force”
In Japan, agricultural laborers are classified in one of the following two ways: “population mainly engaged in farming” and “core persons mainly engaged in farming.” The former is defined as “persons engaged in self-employed farming or persons who are engaged in work other than farming but spend more time engaged in farming on a yearly basis.” “Core persons mainly engaged in farming” refers to those persons from “among the population mainly engaged in farming, who mainly undertake agricultural work during regular hours.” This definition of core persons excludes students and persons who are mainly engaged in housework and child rearing. The Japanese Ministry of Agriculture, Forestry and Fisheries (MAFF) conducts a census survey on the agricultural labor force every five years in February and publishes its results in the Census of Agriculture and Forestry. As of 2010, the total population mainly engaged in farming was 2.61 million, and the total number of core persons who are engaged mainly in agricultural activities (i.e., farmers) was 2.05 million.
2. Decrease in the agricultural labor force
.bmp)
As Table 1 shows, regardless of the definition used, the total number of agricultural laborers has been decreasing over the last 25 years. The rate of the decrease of the total population mainly engaged in farming slowed down during 1995 and 2000 and increased again from 2000 onwards. In particular, it is noteworthy that the total female population mainly engaged in farming has decreased by more than a quarter within a short span of just five years since 2005.
The total number of core persons mainly engaged in farming decreased sharply during 1995-2000. Although the rate of decrease of core persons slowed down during 2000-2005, it rose again during 2005-2010. Similar to the case of the total population mainly engaged in farming, with the exception of the period between 1995 and 2000, the rate of the decrease of female core persons mainly engaged in farming is larger than that of their male counterparts.
Among the total population mainly engaged in farming, people other than the core persons mainly engaged in farming amounted to as large as 1.58 million in 1995, 1.49 million in 2000, and 1.11 million in 2005. However, this number decreased to 0.51 million in 2010. Thus, it is impressive that the total number of people mainly engaged in farming who are not core persons decreased by about half in only five years between 2005 and 2010.
3. Aging of the agricultural labor force
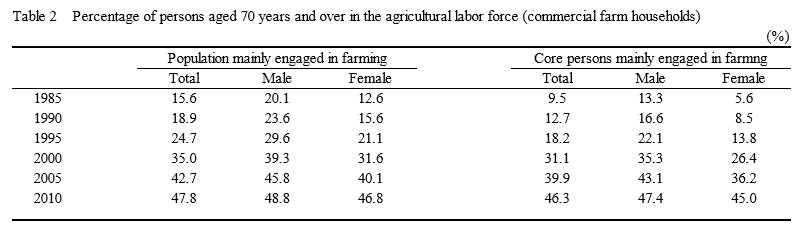
It is also important to track the aging of the agricultural labor force. There are several methodologies to measure their degree of aging. Following Sawada’ study, this paper defines aging of the agricultural labor force in terms of the percentage of persons aged 70 years and more (Sawada, M. 2013. “Kazoku Rodo no Zeijyakuka to Tembo,” Nihon Nogyo no Kozo Henzo edited by M. Ando, Tokyo: Norintokei Kyokai). Table 2 shows the percentages of persons aged 70 and above in the total population of the agricultural labor force. The percentage of persons aged 70 and above in the total population of people mainly engaged in farming increased from 15.6% in 1985 to 47.8% in 2010. Likewise, the percentage of persons aged 70 and above the total number of core persons mainly engaged in farming increased from 9.5% in 1985 to 46.3% in 2010. It is shocking to note that nearly half of the agricultural labor force was aged 70 or above in 2010. The percentages of persons aged 70 and above in both groups are lower among females than males. However, the speed or rate of aging is faster for females than males. As a result, while there were significant gaps in the percentages of persons aged 70 and above between females and males, such gender gaps almost disappeared in 2010.
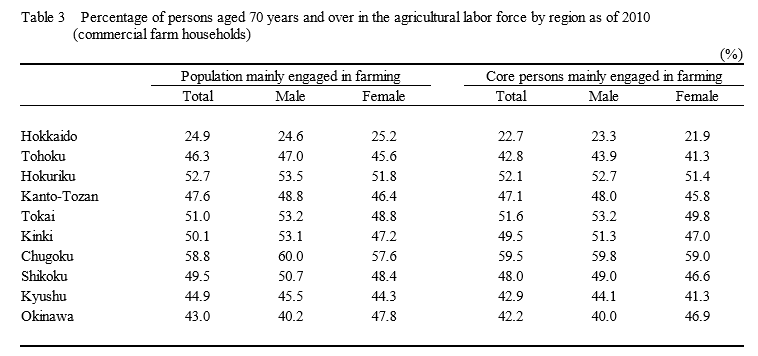
Table 3 compares the percentages of persons aged 70 and above in the agricultural labor force by region. It can be seen that the percentages are particularly high in Hokuriku, Kinki, and Chugoku.
4. Family members in farm households
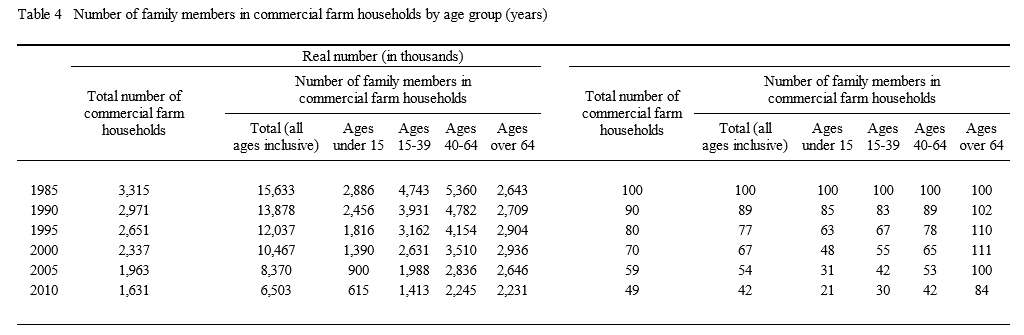
As shown in Table 4, besides the agricultural labor force, members in farm households have also been decreasing in number and show signs of aging. The total number of family members in farm households decreased by 58% between 1985 and 2010. In the same period, the total number of farm households decreased by 51%. This means that the total strength of the agricultural labor force decreased faster than that of farm households.
In particular, the total number of youngsters in farm households has been decreasing sharply; in 2010, the total number of persons aged 14 and below decreased to 21% compared to 1985. In 2010, the number of persons aged 15-39 years decreased to 30% compared to 1985. The total number of persons aged 65 years and over increased till 2000 and started to decrease thereafter. As a result, regardless of the age group, the total number of family members in 2010 fell below the corresponding number in 1985.
5. Generation structure of farm households
The 2000, 2005, and 2010 Censuses of Agriculture and Forestry contain data on the numbers of farm households by single-, two-, and three-generation family farm households. MAFF defines the person in charge of overseeing farm operations as the “farm manager.” Excluding farm managers, MAFF also defines family members engaged in farming for more than 30 days per year as “constituent members of family farming.” By observing the generations of constituent members of family farming, MAFF classifies farm households into three groups: “single-generation family farm households,” “two-generation family farm households,” and “three-generation family farm households.” “Single-generation family farm households” means that constituent members of family farming are of the same generation as the farm manager, e.g., a spouse and siblings. Single-generation family farm households include “single-person family farm households,” which means that there are no constituent members of family farming, and only farm managers are engaged in farming. A two-generation (or three-generation) farm household is defined as a farm household wherein the farm manager and the constituent members of family farming span across two (or three) generations.
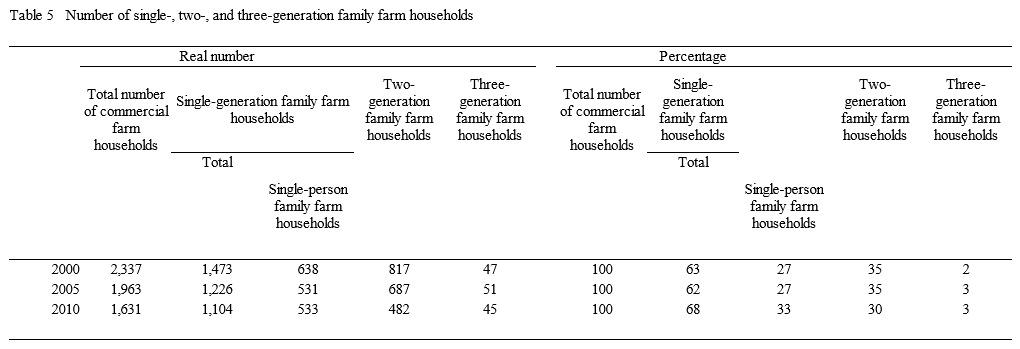
The numbers of single-, two-, and three-generation family farm households for the three census years are shown in Table 5. Single-generation family farm households and single-person family farm households comprise two-thirds and one-third of total farm households respectively. Traditionally, agriculture was operated as a family business. The younger generation gradually took over management resources, such as human networks and farming skills, from the older generation. However, Table 5 shows that today this practice is confined to a minority in Japanese agriculture.
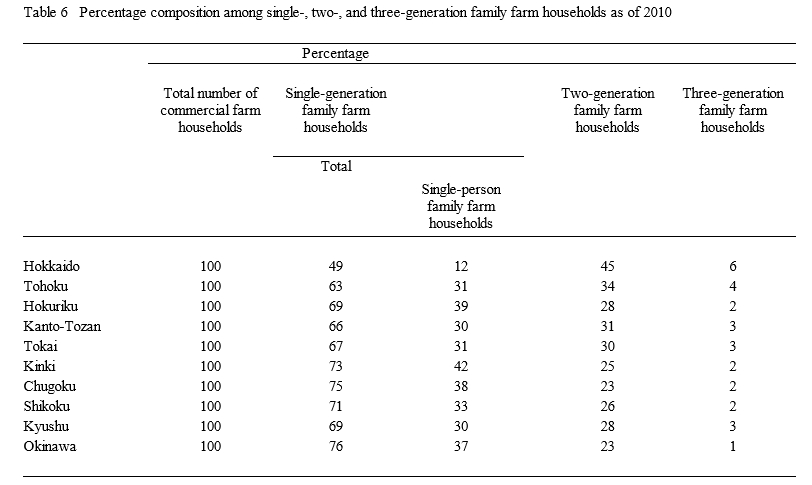
Table 6 compares the percentage composition among single-, two-, and three-generation family farm households. The percentage of single-generation family farm households is particularly high in Chugoku, where the percentages of persons aged 70 years and over in the agricultural labor force is also high (Table 3). The percentage of single-generation family farm households is particularly low in Hokkaido, where the percentages of persons aged 70 years and over in the agricultural labor force is also low (Table 3). This implies that an increase in the percentage of single-generation family farm households is related to the aging of the agricultural labor force.
|
Date submitted: August 30,2013
Reviewed, edited and uploaded: September 3, 2013
|

The Agricultural Labor Force in Japan
Table 3 compares the percentages of persons aged 70 and above in the agricultural labor force by region. It can be seen that the percentages are particularly high in Hokuriku, Kinki, and Chugoku.
4. Family members in farm households
The numbers of single-, two-, and three-generation family farm households for the three census years are shown in Table 5. Single-generation family farm households and single-person family farm households comprise two-thirds and one-third of total farm households respectively. Traditionally, agriculture was operated as a family business. The younger generation gradually took over management resources, such as human networks and farming skills, from the older generation. However, Table 5 shows that today this practice is confined to a minority in Japanese agriculture.