ItthipongMahathanasetha*, KampanatPensuparb
a Department of Agricultural and Resource Economics,
Faculty of Economics, Kasetsart University, Bangkok, Thailand 10900;
E-mail address: fecoipm@ku.ac.th
b Center for Applied Economic Research,
Faculty of Economics, Kasetsart University, Bangkok, Thailand 10900
ABTRACT
Thailand has long been developing its agricultural sector since initiating the first national development plan in 1961. The main agricultural policies under these plans encompass both production and price support programs intended to raise income and living standards of poor farmers in rural areas. Presently, the rice pledging scheme is the most controversial agricultural policy in Thailand. The government offers farmers 500 USD per ton of paddy which is much above the world market prices, resulting enormous stockpile of rice in government procession. Yet, the government believes that Thailand has market power in the global rice market, which enables Thailand to increase the export price of rice by stockpiling and decreasing rice export quantities. In this paper, we estimate the extent of Thailand’s market power in its four major rice export markets including China, Indonesia, USA, and South Africa. The empirical results show that Thailand does not have market power to influence export prices in its four major export markets. Instead, Thailand faces fierce competition from the rice exporting countries of Vietnam and India, whose rice appears to be very close substitutes to Thai rice. It is expected that Thailand will ultimately have to liquidate generic rice in warehouses at the world market price which is substantially lower than its pledging price. All losses incurred by the rice pledging scheme will inevitably be borne by the taxpayers. Appropriate policies toward rice production in the long run should be agricultural productivity enhancement through infrastructure development and farmers’ capacity building rather than the price supports.
Keywords: Thailand, Agricultural policies, Rice export, Market power
INTRODUCTION
Thailand is among one of the most suitable regions on earth for agricultural industry. Therefore, Thailand economy relies mainly on this particular sector. It intertwines seamlessly with the social structure. The fact is that Thai agriculture provides the very large source of food for the region and across the world, not to mention that, it supplies the raw materials to other industries and service sectors. It is also a key to sustainable economic and social development of the country. Though suffering from natural disaster and economic crisis the past few years, Thailand still manages to have sufficient agricultural products for local consumption and exporting business. Figure 1 shows that almost half of the population works in agricultural sector (41.8%) in 2007. It is noted that the amount of workers in such sector clearly decreased from 1990 (63.4%).
.jpg)
Though labor in farming accounted for proportionally large number of all labor combined. The compensation is relatively lower than manufacturing as well as service and other commercial sector. In 2007, the average monthly income for farmers was 120 USD per month whereas those who work in manufacturing, service and commercial sector earned 200 USD and 355 USD per month respectively. Similarly, in 2011, farmers earned monthly 160 USD while the manufacturing, service and commercial sector earned 270 and 418 USD per month, respectively (National Statistical Office, 2011). Farming workers rely primarily on the unpredictable Mother Nature, surely their average income appear to be low. Unfortunately, the characteristic of perishable products plays a large part in this business outcome. As a result, farmers have lower average income and remain financially unstable.
The government has attempted to develop an understanding about agricultural communities as well as changes in socioeconomic infrastructure. Legitimate problems have been identified in order to establish proper policies and procedures. Subsequently, the government has developed the national economic and social development plan. During the first plan,(1961-1966), through the third plan, (1972-1976), the emphasis was about non-commercialized agriculture products and the attempt to lower cost for the production process while using available budgets in building the country's foundation and infrastructure such as highways, electricity generating plants and dams. From the fourth plan (1977-1981) to the sixth plan (1987-1991), the government started to implement the concept of commercialized agriculture, concentrating specially on production for sale, as well as using all means to make a full maximum return per unit. This change was directly influenced from the green revolution.
During the seventh national development plan (1992-1996) through the tenth plan (2007-2011), the emphasis was about sustainable agriculture. It focused on environmental quality and the natural resources. It was also intended to help sustaining the economic viability of farm operation as well as to integrate the harmony in quality of life and income distribution. Additionally it proposed that farmers made the most use from nonrenewable resources and attuned, where appropriate, natural biological cycles.
The importance of the philosophy of sufficiency economy has been emphasized as a continuation from tenth development plan to the current plan, Number 11 (2012-2016). It will advance the practice of farming to become more professional (The smart farmer program). In this discipline, the government officers work alongside the farmers to provide knowledge and problem solving expertise, to promote balance between food crop and energy crop as well as Green product manufacture. The plan also focused on the main goal of food product standardization by increasing the efficiency yet remaining eco-friendly (Ministry of agricultural and cooperatives. 2014a). The main policies under these plans are as followed:
Production policy
The Ministry of Agriculture and Cooperatives is responsible for advancement of agricultural products to meet consumer’s standard both local and abroad. The policy is for promoting quality of agricultural products from farm to table by implementing better quality management system. The improvement in laboratories as well as traceability in crops, livestock and fisheries will result in achieving better traits of the products (Ministry of agricultural and cooperatives, 2014b).
Price intervention policy
Agricultural crop insurance: Established during the second National economic and social development plan, the crop insurance has safeguarded cotton, corn, sorghum, and soybean. During the seventh plan, Bank for Agriculture and Agricultural Cooperatives (BAAC) established the fund to mitigate all damages for rice, both yearly crops and seasonal crops, and damages from natural disasters such as flood, wind and drought for corn and livestock. In the course of development plan number 9, the bank, in accordance with World Bank, the government initiated pilot projects for weather index insurance to minimize damages from drought and flood.
Revenue assurance measure for farmers: The government provides income insurance program for farmers as an alternative way to alleviate the loss due to productivity decline, as seen in the minimum pricing guarantee of agricultural products 2009. This program helps stabilizing the prices. Farmers for all crops register the household crops with BAAC. Farmers then will be compensated the differences between the actual price and the reference criteria.
Pledging program: The government started the rice pledging scheme since the fourth national development plan. During the harvesting season, participants pledge the crops with the government and opt to sell the crops for later higher sale. However, participants must bear the interests and storage fees. Initially, the scheme was only provided for rice. Later on, during the ninth development plan, the scheme also included cassava, maize, garlic, tiger shrimps and white shrimp (Center for applied economic research, 2011).
The rice pledging policy
The most controversial program is the rice pledging scheme beginning in 2011. The main objectives are not only to improve income and living standards of Thai farmers via raising domestic rice prices, but also to increase Thai rice export prices. The government believes that Thailand has market power in the global rice market, which enables Thailand to increase the export price of rice and improve the terms of trade by stockpiling and decreasing rice export quantities (National Rice Policy Committee, 2013). The Thai government offered farmers about 500 USD per ton of paddy, which almost doubled the domestic price of rice in 2010. With a pledging price much above market price, farmers have generally let the government have possessive of their rice in payment for their pledging contracts. As a result, according to the Bank of Agriculture and Agricultural Cooperatives’ financial report, budgetary spending on the rice pledging scheme for the year 2012 stood at about 7 billion USD, while the stockpiles of paddy increased to 14.7 million tons in the production year 2012. Given insufficient domestic demand, the Thai government had no choice but to purchase this enormous surplus paddy, which must be milled and sold aboard for up to 830-870 USD per ton[1] in order to avoid losses[2],[3] whereas the world price of Thai 5% milled rice was on average 573 USD in 2012.
It has been argued by several critics[4] that given the increasing intense competition from formidable rivals such as India and Vietnam, Thailand does not possess sufficient market power to influence the global rice trade. Expecting that the rice pledging policy will be disastrous to Thailand’s sustainable rice production and export in the long run, they are calling on the government to suspend the program.
Whether Thailand has market power in the rice export market is critical to the success or failure of a rice pledging and storage program for Thailand. We employed the residual demand estimation (RDE) pioneered by Goldberg and Knetter (1999) to empirically investigate the extent of market power Thai rice exporters may have in each of four major destinations selected from four different regions including China, Indonesia, USA and South Africa. Thai rice exports to these four countries together account for more than 50 percent of total Thai rice exports in 2011. The degree of competition facing Thai-rice exporters should vary across these markets, depending upon the number of competitors, cross price elasticities, and competitors’ supply responses reflecting in the obtained residual demands. The principal competitors to Thailand in these four markets are Vietnam and India, whose rice exports together with Thailand’s account for more than 50% of world rice exports. Thailand faces competition from Vietnamese rice in China and Indonesia, while India competes with Thailand in the USA and South Africa.
METHODOLOGY
The Theoretical Framework and Model
Consider a group of Thai-rice exporters who collectively sell their product in a specific foreign market[5]. Let pex be the export price of Thai rice (in units of the destination market currency), p1,p2,....pn be the prices of rice from other rice export countries competing with Thailand in this destination market,Qex be the total quantity of rice exports from Thailand to this destination, and Z be a vector of demand shifters in the destination market. Hence, the inverse demand functions for Thai rice and rice from rival countries can be written as follows:
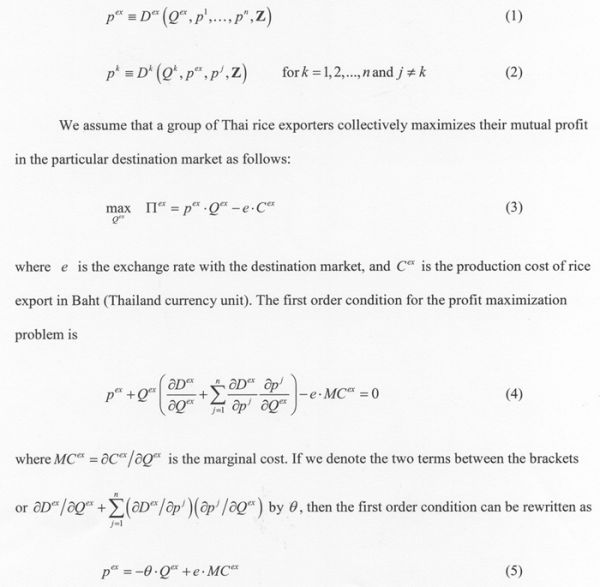
whereQ is called the conjectural or conduct parameter, representing an expected change in price of Thai rice exporters resulting from a change in Thai rice export quantity, taking into account competitors’ supply responses.
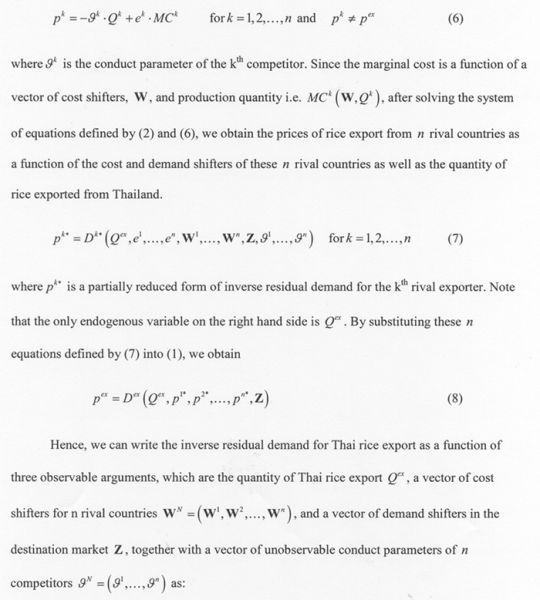
Similarly, we assume that each foreign exporting competitor maximizes profit. The first order condition for each competitor becomes
Econometric Estimation and Data
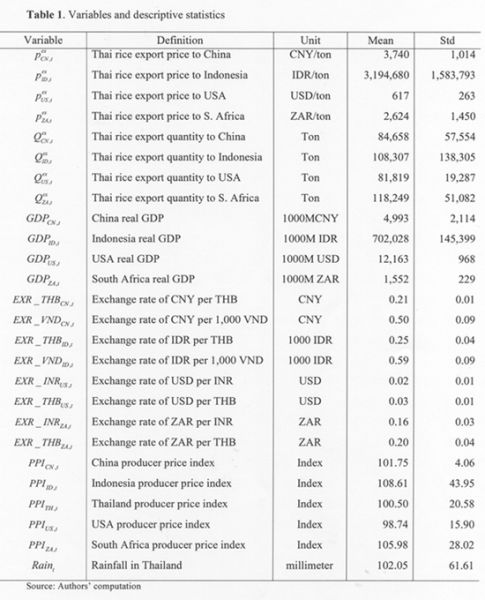
The residual demand given in equation (9) depends on two sets of variables, the vector of demand shifters (Z) and the vector of competitors’ cost shifters (Wn). The demand shifter variables include real GDP in each market destination (GDPm) and time trend (t) which is intended to capture shift in preferences. The competitors’ cost shifter variables consist of the exchange rate of the destination-market currency per unit of competitor’s currency (EXRm) i.e. Chinese Renmenbi (CBY) per 1,000 Vietnamese Dong (VND) for China market destination; Indonesian Rupiah (IDR) per 1,000 VND for Indonesia market destination; US Dollar per Indian Rupee (INR) for the US market destination; South African Rand (ZAR) per INR for South Africa market destination, and domestic rice production costs approximated by the market destination’s producer price index (PPIm). These data are taken from International Monetary Fund’s International Financial Statistics database. The data on quantity and volume of Thai rice export[6] are taken from Thailand Trading Report published on the ministry of commerce’s website[7]. Table 1 below shows the descriptive statistics of data. Our data are quarterly, ranging from the first quarter of 1998 to the fourth quarter of 2012.
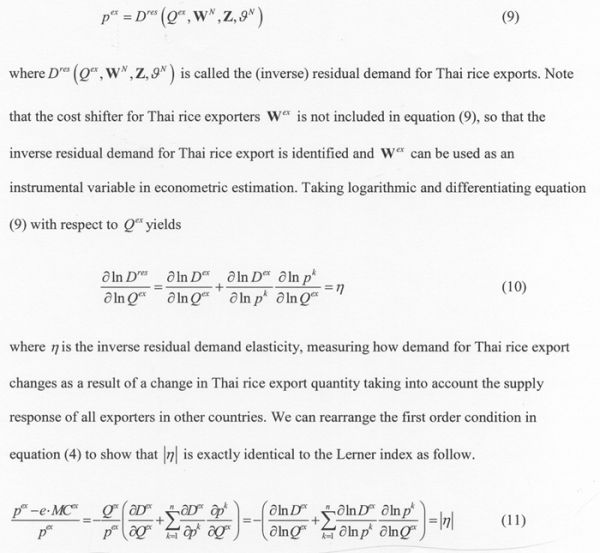
The inverse residual demand curve facing a group of Thai rice exporters defined in each destination market given in equation (9) can be estimated by a log-linear functional specification form as:
.jpg)
EMPIRICAL RESULTS
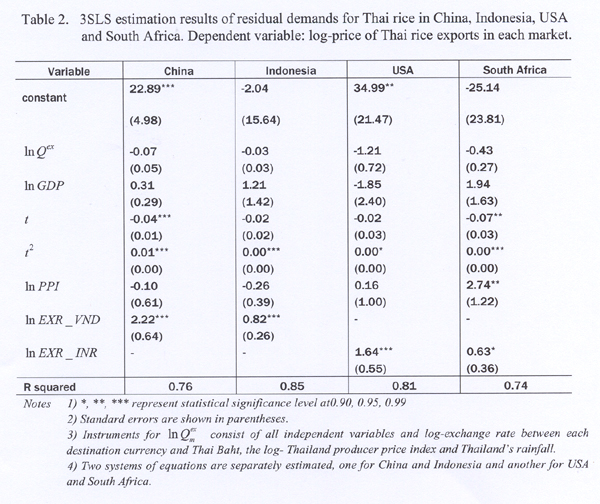
The system of residual demand equations specified by equation (12) is estimated by three-stage least squares (3SLS) and reported in table 2. This procedure, unlike OLS, takes into account potential correlation of error terms across separate equations as well as correlation between export quantities and the error term, to produce more efficient, unbiased and consistent estimates. As noted earlier, Vietnam directly competes with Thailand in China and Indonesia whereas India is a major competitor only in USA and South Africa. Hence, two systems of residual demand equations are separately estimated, one for China and Indonesia as destinations and another for USA and South Africa as destinations.
First consider the joint estimation for China and Indonesia markets. The estimated residual demand elasticities with respect to Thai rice export quantities are -0.07 and -0.03 for China and Indonesia, respectively. Despite their negative sign as expected, both estimates are very small and not statistically different from zero, implying that Thailand does not have market power to influence export prices of rice to China and Indonesia. The coefficients of the CNY-VND and IDR-VND exchange rate are found to be positive 2.22 and 0.82, respectively, and both are statistically significant at 99%. This implies close substitution between Vietnamese rice and Thai rice in China and Indonesia. Intuitively, a depreciation of Vietnamese Dong decreases the selling cost of Vietnam rice in these export markets, forcing Thailand to charge lower prices. On the other hand, Thailand faces no competition with domestic rice producers in each destination as indicated by the fact that the coefficients on both China and Indonesia producer price indexes are not statistically significant, even though they both are negative. This implies that their domestic rice is not considered substitutable with Thai rice in spite of their large amount of domestic rice production[8]. The estimated income elasticities are 0.31 and 1.21 for China and Indonesia, respectively, but neither are statistically different from zero, suggesting that Thai rice is considered a necessary good, and the expenditure share on rice consumption in these countries should decline as incomes increase.
Next, we consider the remaining two markets, USA and South Africa, whose residual demand equations are jointly estimated. The estimated elasticities with respect to log-Thai rice export quantities of residual demands by USA and South Africa are equal to -1.21 and -0.43, respectively. These are negative signs as expected, but are not statistically different from zero, again revealing that Thailand has no market power to influence export prices in either USA or South Africa. The coefficients on log-domestic producer price indexes of USA and South Africa are both positive as expected, but only South Africa is found to be statistically significant at the 95% level, implying that Thai rice export competes with domestically grown rice in the South Africa market, as an increase in the South Africa cost of production significantly and positively affects the Thai rice export price. US rice tends to have higher amylose and firmer cooked texture than Thai rice, so they may be imperfect substitutes for each other. Notably, the coefficients on the exchange rate of USD-INR and ZAR-INR both are statistically significant at 99% and 90%, respectively. Thus, Indian rice is a formidable rival for Thai rice in the US and South Africa Markets.
CONCLUSION AND POLICY IMPLICATIONS
Thai government is currently implementing a rice pledging scheme offering farmers 500 USD per ton of paddy, substantially higher than the world price, in the belief that the country has market power to raise the world price by stockpiling rice and reducing its rice exports. However, whether this policy is achievable remains debatable and depends crucially on whether Thailand has market power in its major rice export markets including China, Indonesia, USA and South Africa. Such information is needed to justify the policy which has profound implications on income distributional consequences as rice is the main crop grown by the poorest people in Thailand.
To achieve our objective, we adopt the RDE approach to test for the existence and extent of market power of Thailand in its rice exports. Our evidence soundly rejects the hypothesis that Thailand has market power because the demand elasticities appear to be statistically insignificant in all markets while competitors’ exchange rates are found to be highly significant, implying that Thailand’s ability to influence its rice export prices are apparently constrained by intense competition from Vietnamese and Indian rice.
Our findings provide implications for government policy toward rice production. First, that the Thai government is purchasing every kind of paddy rice from farmers regardless of quality at the same price of 500 USD per ton may cause a serious problem by inducing farmers to shift their production toward cheap-cost, fast-growing, but low-quality rice. Our empirical results also suggest that Thailand has no ability to increase its export prices by self-restriction on export quantities and predict that Thailand, facing formidable competition from cheaper but closely substitutable Vietnamese and Indian rice, will ultimately have to liquidate rice in warehouses at the world market price which is substantially lower than its pledging price. All losses incurred by the rice pledging scheme will inevitably be borne by the taxpayers[9],[10].
Apparently, Thailand has lost its comparative advantage in low-quality rice markets to the lower rice production cost rivals, Vietnam and India, whose agricultural wages and land rents remain relatively cheaper. Hence, in order to be competitive and survive in the long run, an appropriate policy toward rice production in Thailand might be agricultural productivity enhancement through infrastructure development and farmers’ capacity building such as education and training rather than permanent production subsidy or price supports. According to Suphannachart and Warr (2011), the irrigation area contributes to only 9% of total agricultural land and a few portion of annual government budget is allocated to agricultural R&D in spite of their significant impacts on agricultural productivity improvement in Thailand.
REFERENCE
Center for Applied Economic Research (CAER). 2011.Agriculture and Food Industry Research and Development Mechanism under ASEAN Economic Community (AEC) in 2015. Faculty of Economics, Kasetsart University.
Goldberg, P.K. and M.M. Knetter. 1999. Measuring the Intensity of Competition in Export Markets.Journal of International Economics 47: 27-60.
Ministry of Agricultural and Cooperatives. 2014a. Mean driving the Smart farmer and Smart Officers Policy. (http://www.opsmoac.go.th/ewt_dl_link.php?nid=7762; Accessed March 18, 2014)
Ministry of Agricultural and Cooperatives.2014b. Agricultural Development plan during the national economic and social development plan.(http://www.oae.go.th/download/document_plan/planAgi11_Sep55.pdf; Accessed March 18, 2014)
National Rice Policy Committee. 2013. Rice Pledging Scheme. (www.dit.go.th; Accessed March 18, 2014)
National Statistical Office. 2011. Survey project in labor and work life 3rd quarter 1990-2011. (http://service.nso.go.th/nso/web/article/article_36.html; Accessed March 18, 2014)
Somporn Isaviranon. 2013. Thai Rice and its dominating power in the world market.
Suphannachart W. and P. Warr. 2011. Research and Productivity in Thai Agriculture. The Australian Journal Agricultural and Resource Economics 55: 35-52.
|
Submitted as a country paper for the FFTC-COA International Workshop on Collection of Relevant Agricultural Policy Information and its Practical Use, June 23-27, 2014, Taipei, Taiwan R.O.C. |
[1] Normally, in an ideal milling process, one ton of paddy rice gives approximately 0.6 – 0.7 ton of white rice, depending on the rice variety.
[2] “The volatile politics of rice” by Michael Richardson, The Japan Times, October 14, 2011
[3] “Thailand, subsidies and the price of rice” by Simon Montlake, Forbes, September 22, 2012
[4] “Sustainable rice prices are set by the market” by Viroj Na Ranong, Bangkok Post, June 19, 2013
[5] This assumption is justified by the fact that only a few private companies manage the exports of rice from Thailand. Most of them are members of Thai rice exporter association whose stated main objectives are to promote a unified network among members and to render collaboration and support to the government concerning rice trading policy.
[6] The 4-digit harmonize code of rice is 1006
[8] China and Indonesia are the 1st and 3rd world’s largest rice production countries in 2011, respectively.
[9] The Bank for Agriculture and Agricultural Cooperative reports that government has 14.7 million tones of paddy in their warehouse on November 2013. The budget spent on the paddy pledging scheme is 7 billion USD. Simple estimation yields the Government’s loss up to 600-700 million USD. However, this estimation is uncertain since the actual loss is still unannounced by the Government.

THAI Agricultural Policies: The Rice Pledging Scheme
ItthipongMahathanasetha*, KampanatPensuparb
a Department of Agricultural and Resource Economics,
Faculty of Economics, Kasetsart University, Bangkok, Thailand 10900;
E-mail address: fecoipm@ku.ac.th
b Center for Applied Economic Research,
Faculty of Economics, Kasetsart University, Bangkok, Thailand 10900
ABTRACT
Thailand has long been developing its agricultural sector since initiating the first national development plan in 1961. The main agricultural policies under these plans encompass both production and price support programs intended to raise income and living standards of poor farmers in rural areas. Presently, the rice pledging scheme is the most controversial agricultural policy in Thailand. The government offers farmers 500 USD per ton of paddy which is much above the world market prices, resulting enormous stockpile of rice in government procession. Yet, the government believes that Thailand has market power in the global rice market, which enables Thailand to increase the export price of rice by stockpiling and decreasing rice export quantities. In this paper, we estimate the extent of Thailand’s market power in its four major rice export markets including China, Indonesia, USA, and South Africa. The empirical results show that Thailand does not have market power to influence export prices in its four major export markets. Instead, Thailand faces fierce competition from the rice exporting countries of Vietnam and India, whose rice appears to be very close substitutes to Thai rice. It is expected that Thailand will ultimately have to liquidate generic rice in warehouses at the world market price which is substantially lower than its pledging price. All losses incurred by the rice pledging scheme will inevitably be borne by the taxpayers. Appropriate policies toward rice production in the long run should be agricultural productivity enhancement through infrastructure development and farmers’ capacity building rather than the price supports.
Keywords: Thailand, Agricultural policies, Rice export, Market power
INTRODUCTION
Thailand is among one of the most suitable regions on earth for agricultural industry. Therefore, Thailand economy relies mainly on this particular sector. It intertwines seamlessly with the social structure. The fact is that Thai agriculture provides the very large source of food for the region and across the world, not to mention that, it supplies the raw materials to other industries and service sectors. It is also a key to sustainable economic and social development of the country. Though suffering from natural disaster and economic crisis the past few years, Thailand still manages to have sufficient agricultural products for local consumption and exporting business. Figure 1 shows that almost half of the population works in agricultural sector (41.8%) in 2007. It is noted that the amount of workers in such sector clearly decreased from 1990 (63.4%).
Though labor in farming accounted for proportionally large number of all labor combined. The compensation is relatively lower than manufacturing as well as service and other commercial sector. In 2007, the average monthly income for farmers was 120 USD per month whereas those who work in manufacturing, service and commercial sector earned 200 USD and 355 USD per month respectively. Similarly, in 2011, farmers earned monthly 160 USD while the manufacturing, service and commercial sector earned 270 and 418 USD per month, respectively (National Statistical Office, 2011). Farming workers rely primarily on the unpredictable Mother Nature, surely their average income appear to be low. Unfortunately, the characteristic of perishable products plays a large part in this business outcome. As a result, farmers have lower average income and remain financially unstable.
The government has attempted to develop an understanding about agricultural communities as well as changes in socioeconomic infrastructure. Legitimate problems have been identified in order to establish proper policies and procedures. Subsequently, the government has developed the national economic and social development plan. During the first plan,(1961-1966), through the third plan, (1972-1976), the emphasis was about non-commercialized agriculture products and the attempt to lower cost for the production process while using available budgets in building the country's foundation and infrastructure such as highways, electricity generating plants and dams. From the fourth plan (1977-1981) to the sixth plan (1987-1991), the government started to implement the concept of commercialized agriculture, concentrating specially on production for sale, as well as using all means to make a full maximum return per unit. This change was directly influenced from the green revolution.
During the seventh national development plan (1992-1996) through the tenth plan (2007-2011), the emphasis was about sustainable agriculture. It focused on environmental quality and the natural resources. It was also intended to help sustaining the economic viability of farm operation as well as to integrate the harmony in quality of life and income distribution. Additionally it proposed that farmers made the most use from nonrenewable resources and attuned, where appropriate, natural biological cycles.
The importance of the philosophy of sufficiency economy has been emphasized as a continuation from tenth development plan to the current plan, Number 11 (2012-2016). It will advance the practice of farming to become more professional (The smart farmer program). In this discipline, the government officers work alongside the farmers to provide knowledge and problem solving expertise, to promote balance between food crop and energy crop as well as Green product manufacture. The plan also focused on the main goal of food product standardization by increasing the efficiency yet remaining eco-friendly (Ministry of agricultural and cooperatives. 2014a). The main policies under these plans are as followed:
Production policy
The Ministry of Agriculture and Cooperatives is responsible for advancement of agricultural products to meet consumer’s standard both local and abroad. The policy is for promoting quality of agricultural products from farm to table by implementing better quality management system. The improvement in laboratories as well as traceability in crops, livestock and fisheries will result in achieving better traits of the products (Ministry of agricultural and cooperatives, 2014b).
Price intervention policy
Agricultural crop insurance: Established during the second National economic and social development plan, the crop insurance has safeguarded cotton, corn, sorghum, and soybean. During the seventh plan, Bank for Agriculture and Agricultural Cooperatives (BAAC) established the fund to mitigate all damages for rice, both yearly crops and seasonal crops, and damages from natural disasters such as flood, wind and drought for corn and livestock. In the course of development plan number 9, the bank, in accordance with World Bank, the government initiated pilot projects for weather index insurance to minimize damages from drought and flood.
Revenue assurance measure for farmers: The government provides income insurance program for farmers as an alternative way to alleviate the loss due to productivity decline, as seen in the minimum pricing guarantee of agricultural products 2009. This program helps stabilizing the prices. Farmers for all crops register the household crops with BAAC. Farmers then will be compensated the differences between the actual price and the reference criteria.
Pledging program: The government started the rice pledging scheme since the fourth national development plan. During the harvesting season, participants pledge the crops with the government and opt to sell the crops for later higher sale. However, participants must bear the interests and storage fees. Initially, the scheme was only provided for rice. Later on, during the ninth development plan, the scheme also included cassava, maize, garlic, tiger shrimps and white shrimp (Center for applied economic research, 2011).
The rice pledging policy
The most controversial program is the rice pledging scheme beginning in 2011. The main objectives are not only to improve income and living standards of Thai farmers via raising domestic rice prices, but also to increase Thai rice export prices. The government believes that Thailand has market power in the global rice market, which enables Thailand to increase the export price of rice and improve the terms of trade by stockpiling and decreasing rice export quantities (National Rice Policy Committee, 2013). The Thai government offered farmers about 500 USD per ton of paddy, which almost doubled the domestic price of rice in 2010. With a pledging price much above market price, farmers have generally let the government have possessive of their rice in payment for their pledging contracts. As a result, according to the Bank of Agriculture and Agricultural Cooperatives’ financial report, budgetary spending on the rice pledging scheme for the year 2012 stood at about 7 billion USD, while the stockpiles of paddy increased to 14.7 million tons in the production year 2012. Given insufficient domestic demand, the Thai government had no choice but to purchase this enormous surplus paddy, which must be milled and sold aboard for up to 830-870 USD per ton[1] in order to avoid losses[2],[3] whereas the world price of Thai 5% milled rice was on average 573 USD in 2012.
It has been argued by several critics[4] that given the increasing intense competition from formidable rivals such as India and Vietnam, Thailand does not possess sufficient market power to influence the global rice trade. Expecting that the rice pledging policy will be disastrous to Thailand’s sustainable rice production and export in the long run, they are calling on the government to suspend the program.
Whether Thailand has market power in the rice export market is critical to the success or failure of a rice pledging and storage program for Thailand. We employed the residual demand estimation (RDE) pioneered by Goldberg and Knetter (1999) to empirically investigate the extent of market power Thai rice exporters may have in each of four major destinations selected from four different regions including China, Indonesia, USA and South Africa. Thai rice exports to these four countries together account for more than 50 percent of total Thai rice exports in 2011. The degree of competition facing Thai-rice exporters should vary across these markets, depending upon the number of competitors, cross price elasticities, and competitors’ supply responses reflecting in the obtained residual demands. The principal competitors to Thailand in these four markets are Vietnam and India, whose rice exports together with Thailand’s account for more than 50% of world rice exports. Thailand faces competition from Vietnamese rice in China and Indonesia, while India competes with Thailand in the USA and South Africa.
METHODOLOGY
The Theoretical Framework and Model
Consider a group of Thai-rice exporters who collectively sell their product in a specific foreign market[5]. Let pex be the export price of Thai rice (in units of the destination market currency), p1,p2,....pn be the prices of rice from other rice export countries competing with Thailand in this destination market,Qex be the total quantity of rice exports from Thailand to this destination, and Z be a vector of demand shifters in the destination market. Hence, the inverse demand functions for Thai rice and rice from rival countries can be written as follows:
whereQ is called the conjectural or conduct parameter, representing an expected change in price of Thai rice exporters resulting from a change in Thai rice export quantity, taking into account competitors’ supply responses.
Similarly, we assume that each foreign exporting competitor maximizes profit. The first order condition for each competitor becomes
Econometric Estimation and Data
The residual demand given in equation (9) depends on two sets of variables, the vector of demand shifters (Z) and the vector of competitors’ cost shifters (Wn). The demand shifter variables include real GDP in each market destination (GDPm) and time trend (t) which is intended to capture shift in preferences. The competitors’ cost shifter variables consist of the exchange rate of the destination-market currency per unit of competitor’s currency (EXRm) i.e. Chinese Renmenbi (CBY) per 1,000 Vietnamese Dong (VND) for China market destination; Indonesian Rupiah (IDR) per 1,000 VND for Indonesia market destination; US Dollar per Indian Rupee (INR) for the US market destination; South African Rand (ZAR) per INR for South Africa market destination, and domestic rice production costs approximated by the market destination’s producer price index (PPIm). These data are taken from International Monetary Fund’s International Financial Statistics database. The data on quantity and volume of Thai rice export[6] are taken from Thailand Trading Report published on the ministry of commerce’s website[7]. Table 1 below shows the descriptive statistics of data. Our data are quarterly, ranging from the first quarter of 1998 to the fourth quarter of 2012.
The inverse residual demand curve facing a group of Thai rice exporters defined in each destination market given in equation (9) can be estimated by a log-linear functional specification form as:
EMPIRICAL RESULTS
The system of residual demand equations specified by equation (12) is estimated by three-stage least squares (3SLS) and reported in table 2. This procedure, unlike OLS, takes into account potential correlation of error terms across separate equations as well as correlation between export quantities and the error term, to produce more efficient, unbiased and consistent estimates. As noted earlier, Vietnam directly competes with Thailand in China and Indonesia whereas India is a major competitor only in USA and South Africa. Hence, two systems of residual demand equations are separately estimated, one for China and Indonesia as destinations and another for USA and South Africa as destinations.
First consider the joint estimation for China and Indonesia markets. The estimated residual demand elasticities with respect to Thai rice export quantities are -0.07 and -0.03 for China and Indonesia, respectively. Despite their negative sign as expected, both estimates are very small and not statistically different from zero, implying that Thailand does not have market power to influence export prices of rice to China and Indonesia. The coefficients of the CNY-VND and IDR-VND exchange rate are found to be positive 2.22 and 0.82, respectively, and both are statistically significant at 99%. This implies close substitution between Vietnamese rice and Thai rice in China and Indonesia. Intuitively, a depreciation of Vietnamese Dong decreases the selling cost of Vietnam rice in these export markets, forcing Thailand to charge lower prices. On the other hand, Thailand faces no competition with domestic rice producers in each destination as indicated by the fact that the coefficients on both China and Indonesia producer price indexes are not statistically significant, even though they both are negative. This implies that their domestic rice is not considered substitutable with Thai rice in spite of their large amount of domestic rice production[8]. The estimated income elasticities are 0.31 and 1.21 for China and Indonesia, respectively, but neither are statistically different from zero, suggesting that Thai rice is considered a necessary good, and the expenditure share on rice consumption in these countries should decline as incomes increase.
Next, we consider the remaining two markets, USA and South Africa, whose residual demand equations are jointly estimated. The estimated elasticities with respect to log-Thai rice export quantities of residual demands by USA and South Africa are equal to -1.21 and -0.43, respectively. These are negative signs as expected, but are not statistically different from zero, again revealing that Thailand has no market power to influence export prices in either USA or South Africa. The coefficients on log-domestic producer price indexes of USA and South Africa are both positive as expected, but only South Africa is found to be statistically significant at the 95% level, implying that Thai rice export competes with domestically grown rice in the South Africa market, as an increase in the South Africa cost of production significantly and positively affects the Thai rice export price. US rice tends to have higher amylose and firmer cooked texture than Thai rice, so they may be imperfect substitutes for each other. Notably, the coefficients on the exchange rate of USD-INR and ZAR-INR both are statistically significant at 99% and 90%, respectively. Thus, Indian rice is a formidable rival for Thai rice in the US and South Africa Markets.
CONCLUSION AND POLICY IMPLICATIONS
Thai government is currently implementing a rice pledging scheme offering farmers 500 USD per ton of paddy, substantially higher than the world price, in the belief that the country has market power to raise the world price by stockpiling rice and reducing its rice exports. However, whether this policy is achievable remains debatable and depends crucially on whether Thailand has market power in its major rice export markets including China, Indonesia, USA and South Africa. Such information is needed to justify the policy which has profound implications on income distributional consequences as rice is the main crop grown by the poorest people in Thailand.
To achieve our objective, we adopt the RDE approach to test for the existence and extent of market power of Thailand in its rice exports. Our evidence soundly rejects the hypothesis that Thailand has market power because the demand elasticities appear to be statistically insignificant in all markets while competitors’ exchange rates are found to be highly significant, implying that Thailand’s ability to influence its rice export prices are apparently constrained by intense competition from Vietnamese and Indian rice.
Our findings provide implications for government policy toward rice production. First, that the Thai government is purchasing every kind of paddy rice from farmers regardless of quality at the same price of 500 USD per ton may cause a serious problem by inducing farmers to shift their production toward cheap-cost, fast-growing, but low-quality rice. Our empirical results also suggest that Thailand has no ability to increase its export prices by self-restriction on export quantities and predict that Thailand, facing formidable competition from cheaper but closely substitutable Vietnamese and Indian rice, will ultimately have to liquidate rice in warehouses at the world market price which is substantially lower than its pledging price. All losses incurred by the rice pledging scheme will inevitably be borne by the taxpayers[9],[10].
Apparently, Thailand has lost its comparative advantage in low-quality rice markets to the lower rice production cost rivals, Vietnam and India, whose agricultural wages and land rents remain relatively cheaper. Hence, in order to be competitive and survive in the long run, an appropriate policy toward rice production in Thailand might be agricultural productivity enhancement through infrastructure development and farmers’ capacity building such as education and training rather than permanent production subsidy or price supports. According to Suphannachart and Warr (2011), the irrigation area contributes to only 9% of total agricultural land and a few portion of annual government budget is allocated to agricultural R&D in spite of their significant impacts on agricultural productivity improvement in Thailand.
REFERENCE
Center for Applied Economic Research (CAER). 2011.Agriculture and Food Industry Research and Development Mechanism under ASEAN Economic Community (AEC) in 2015. Faculty of Economics, Kasetsart University.
Goldberg, P.K. and M.M. Knetter. 1999. Measuring the Intensity of Competition in Export Markets.Journal of International Economics 47: 27-60.
Ministry of Agricultural and Cooperatives. 2014a. Mean driving the Smart farmer and Smart Officers Policy. (http://www.opsmoac.go.th/ewt_dl_link.php?nid=7762; Accessed March 18, 2014)
Ministry of Agricultural and Cooperatives.2014b. Agricultural Development plan during the national economic and social development plan.(http://www.oae.go.th/download/document_plan/planAgi11_Sep55.pdf; Accessed March 18, 2014)
National Rice Policy Committee. 2013. Rice Pledging Scheme. (www.dit.go.th; Accessed March 18, 2014)
National Statistical Office. 2011. Survey project in labor and work life 3rd quarter 1990-2011. (http://service.nso.go.th/nso/web/article/article_36.html; Accessed March 18, 2014)
Somporn Isaviranon. 2013. Thai Rice and its dominating power in the world market.
Suphannachart W. and P. Warr. 2011. Research and Productivity in Thai Agriculture. The Australian Journal Agricultural and Resource Economics 55: 35-52.
[1] Normally, in an ideal milling process, one ton of paddy rice gives approximately 0.6 – 0.7 ton of white rice, depending on the rice variety.
[2] “The volatile politics of rice” by Michael Richardson, The Japan Times, October 14, 2011
[3] “Thailand, subsidies and the price of rice” by Simon Montlake, Forbes, September 22, 2012
[4] “Sustainable rice prices are set by the market” by Viroj Na Ranong, Bangkok Post, June 19, 2013
[5] This assumption is justified by the fact that only a few private companies manage the exports of rice from Thailand. Most of them are members of Thai rice exporter association whose stated main objectives are to promote a unified network among members and to render collaboration and support to the government concerning rice trading policy.
[6] The 4-digit harmonize code of rice is 1006
[7]www.op3.moc.go.th/hs/export_yearly/ (Accessed August 2013)
[8] China and Indonesia are the 1st and 3rd world’s largest rice production countries in 2011, respectively.
[9] The Bank for Agriculture and Agricultural Cooperative reports that government has 14.7 million tones of paddy in their warehouse on November 2013. The budget spent on the paddy pledging scheme is 7 billion USD. Simple estimation yields the Government’s loss up to 600-700 million USD. However, this estimation is uncertain since the actual loss is still unannounced by the Government.
[10]http://www.thaigov.go.th/en/news-room/item/72404-the-governments-rice-pl... (last accessed on October 2013)