ABSTRACT
Over 30 years since the reform policy, Vietnam has been successfully transformed from a central planning to a market-oriented economy, and from a low income to a middle-income country. The poverty rate reduced sharply and the general inequality index has been stable. However, there is a persistent separation between urban and rural areas, inland and bordering areas, ethnic minorities and the Kinh. In theory, migration could either help balance the inequality through wage equalization or increase inequality as a consequence of “brain drain.” We use the panel data of 2,740 households from the Vietnam Access to Resources Household Survey to analyze the correlation of migration and inequality. The results provide evidence that migration has a positive impact on reducing inequality in Vietnam but such impact is expected to be reduced as the communities become more equal. Policy implications are improving inter-regional linkages and removing migration restrictions to tackle regional separation and inequality.
Key words: Migration, ethnicity minorities, inequality, Vietnam
INTRODUCTION
After nearly 30 years of reform, Vietnam has made outstanding economic and social achievements. Between 1986 and 2015, Vietnam’s average economic growth was about 6.52%, one of the fastest growth rates in the world. The poverty rate dropped from 28.9 in 2002 to 8.4% in 2014 (GSO 2016). The rural poverty rate felt quicker than the urban one, keeping inequality in check. Gini coefficient has been kept at 0.42 - 0.43 since 2002.
However, the inter-regional income gap is still significant. The urban/ rural income ratio is almost 2 in 2014 (GSO 2016). The poverty rate of bordering area has doubled that of inland. Migration might help to narrow this gap if wage equalization between areas is enabled (Todaro 1969). However, this might not happen due to the "brain drain" phenomenon (Adam 1969) and the fixed cost of migration that prevents the poor from migrating (Lipton 1980).
This paper uses the 2012-2014 panel of 2,740 households from Vietnam Access to Resources Household Survey (VARHS) to estimate the impact of migration on inequality at migrant-sending rural areas.
GROWTH, POVERTY AND INEQUALITY IN VIETNAM
From a poor country in the 1980s, Vietnam has become a middle-income country. In 2015, the average GDP per capita is around US$2,200 at current prices, equivalent to about US$6,000 on purchasing power parity. The growth rate of GDP per capita of Vietnam was 5.5 per cent/ year in 1990-2015, contributing to three-and-a-half time increase in average income on purchasing power parity (World Bank 2016).
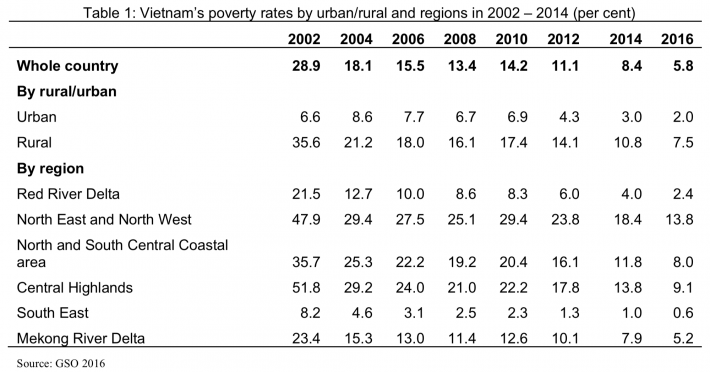
The economic growth has been broad-based, contributing to the sharp decrease in the poverty rate. However, poverty rate in rural areas was significantly higher and reduced slower than in urban areas. In 2016, the rural poverty rate was almost 4 times higher than the urban one. Poverty concentrates in ethnic minorities (in 2017, more than half of poor households are ethnic minorities ones). There is also significant difference in the poverty rates across regions. The two regions with the highest poverty rate are the North Mountainous Area and Central Highlands, where most of ethnic minorities live (Table 1).
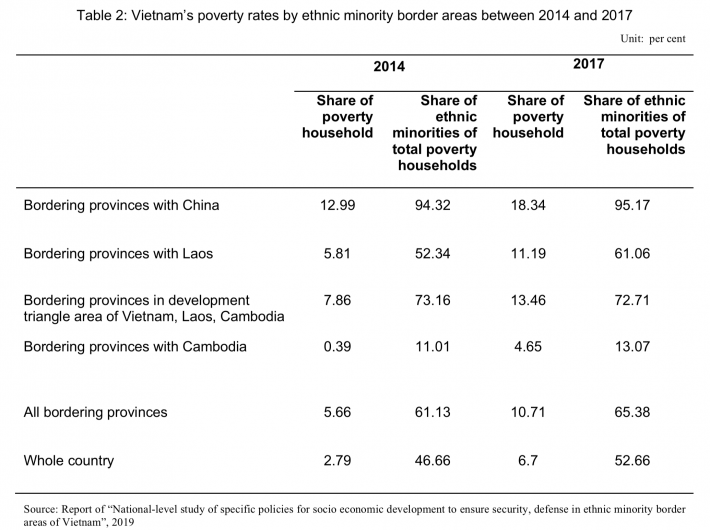
Noteworthily, particularly, according to the “National-level study of specific policies for socio economic development to ensure security, defense in ethnic minority border areas of Vietnam project,” the rate of ethnic minority household of total households varies significantly among bordering areas. In 2017, almost all of poverty households in bordering provinces with China was ethnic minorities (95.2%) whereas that of bordering provinces with Cambodia is only 17.1% (Table 2). The poorest ethnic groups in the bordering areas with China are La Hu, Mang, Lo Lo, in the bordering area with Lao is Kho Mu; in the bordering areas with Cambodia is Khmer.
Noteworthily, in contrast with the decrease of inequality in urban areas, the inequality in rural areas was at the increasing trend from 0.36 in 2002 to 0.41 in 2012. The North East and North West are not only the poorest regions but also those having the highest inequality level recently (Table 3).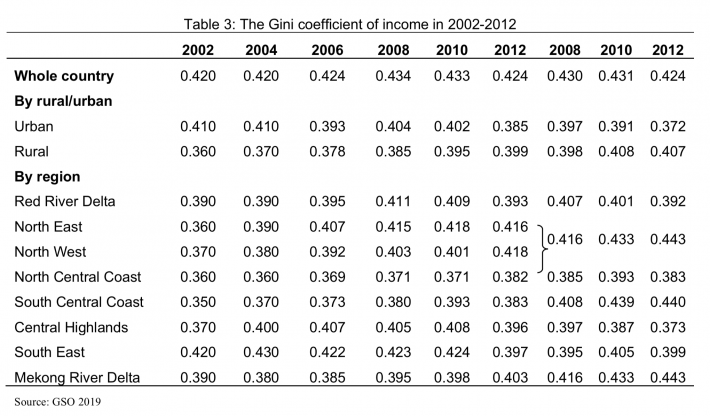
MIGRATION IN VIETNAM
Rural – urban migration
The 2009 Population and Housing Census showed that the number of migrants in 2009 was 6.5 million, a 2.3 fold increase since 1999. Between the two censuses, the share of migrants increases in both urban (15.3 to 16.3%) and rural areas (2.8 to 5.0%). The majority of migrants were from rural areas, in which, rural-urban migrants accounted for nearly one third of total number of migrants (Table 4).
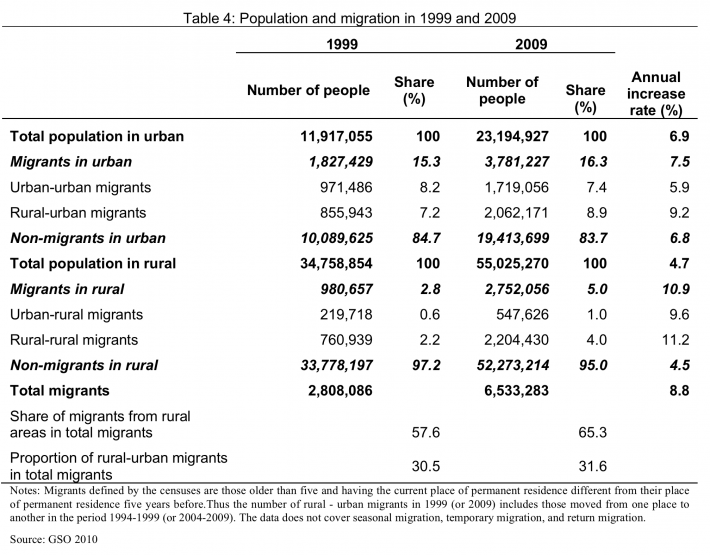
Vietnam is considered to be having a rapid urbanization process. The share of urban population in total population was 34% in 2015 (GSO 2016), up from 20% in 1986 (GSO 2004). A considerable part of this urban population expansion comes from rural - urban migrants. From 1999 to 2009, rural - urban migration contributed to raise the population growth rate in urban area to 3.4% and reduce the population growth rate in rural area to 0.4% per year, while there is little difference in the birth and death rates between the two areas (GSO 2010). In 2009, 16% of urban population are migrants who moved there in less than 5 years (GSO 2010).
The Government of Vietnam set to increase the urban population to 50% of total population by 2025. It seems to be an ambitious plan, though. Given the current age structure and patterns of birth, mortality, and immigration rates, the urban share of population would only reach 50% by 2035-2040 (GSO 2011).
The government might have counted on the accelerated rural - urban migration flow in setting up the urbanization target. However, Dang (2009) argues that the state development programs disregard or aim to limit migration. Specially, residency-based social policies are making rural - urban migrants marginalized (Le et al. 2011).
ASSESSMENT OF MIGRATION AND ETHNICITY EMPLOYMENT
Vietnam has 54 ethnic groups. Most of Vietnam’s ethnic minorities live in remote, lightly populated mountain regions in northern, central and western Vietnam. The largest minorities in the north are the Tay (1.6% of the Vietnamese population), Muong (1.4%), Tai (1.2%), Nung (1%) and others (2.3) %). The main minorities in the south are Chinese, Montagnard (1.5%), Khmer (1.2%) and Cham (0.1%).
Almost all their languages belong to the five language families of Southeast Asia and they can be considered as sharing ―the same historical and cultural horizon of the past which spread from south of the Yangtze River to the Islands of Southeast Asia‖ (Dang et al. 2000). Some of these groups have been in Vietnam since the earliest times (for example, the Viet, the Tay-Thai groups), while some arrived as recently as around the 17th to 19th centuries (for example, the Hanhi, the Lahu, the Lolo groups) and some came to Vietnam throughout different periods, but mostly in the last millennium (for example, the Hoa, the Nung, the Vankieu groups) (Dang et al., 2000.) The Kinh or Viet (ethnic Vietnamese) is the largest group, accounting for 86% of the population. The next largest groups are the Tay, the Thai, the Muong, the Khmer (ethnic Cambodian), the Hoa (ethnic Chinese), and the Hmong, which together represent 10% of the population, and the remaining ethnic groups make up 4% of the population (GSO 2001a).
The World Bank, in its Country Social Analysis report (World Bank 2009), identifies six areas where ethnic minorities have a disadvantage compared with ethnic majorities:
- Ethnic minorities have less access to education, higher dropout rates, and later school enrolment. There is lack of ethnic minority teachers and bilingual education for ethnic minorities. School fees also represent a burden for ethnic minorities.
- Ethnic minorities have less mobility, with Kinh migrant households enjoying better benefits from government programs and their social networks. Kinh migration even has had negative effects on local minorities in certain places.
- Ethnic minorities have less access to formal financial services.
- Ethnic minorities have less productive land, while they are more dependent on swidden agriculture and have less off-farm employment.
- Ethnic minorities have lower market access and poorer returns from markets. While this varies among ethnic groups, ethnic minorities engage in trading activities less than the Kinh group.
- Ethnic minorities are subject to stereotyping and misconceptions, not just among Kinh households but even among ethnic minorities themselves, which can much hinder participation by ethnic minorities in their own development.
Government Policies and Programs for Ethnic Minorities to create jobs, reduce poverty
The Government of Vietnam (GOV) has paid much attention to the welfare of ethnic minority groups. There is a ministerial-level government body, the Committee for Ethnic Minority and Mountainous Area Affairs (CEMA), which is in charge of management functions for ethnic minorities and mountainous areas. In geographically strategic areas or areas with an ethnic minority population of 5,000 or more, CEMA has its own representative agency down to the district-level (GOV 2004a). Programs that specially target ethnic minority groups are numerous and diverse. These programs are diverse and cover a wide range of issues including poverty reduction, resettlement and sedentarization, forest land allocation, education, health and communication. They benefit those minority groups through several channels such as: i) their ethnic identity; ii) their (usually mountainous or remote) residence areas; iii) their (usually poor) economic status; and iv) general social programs for households with war martyrs, war invalids or recognized as having contributed to the government. Programs that target ethnic minority groups through ethnic identity include such activities as cash subsidies on land reclamation, house construction, and drinking water improvement (GOV 2004b), cash grants on food, production tools and seedlings (GOV 1995), and interest-free loans for poor households (GOV 2007a). Programs that target ethnic minority groups through their residence areas include such activities as improving commune and village infrastructure, developing communal centers, planning residential areas, providing agricultural extension services, and training commune level cadres (GOV 1998a and 2007b). Programs that target ethnic minority groups through their poor economic status include activities such as reducing poverty rates and creating jobs (GOV 1998b and 2001). And programs that target ethnic minority groups through their contribution to the wars or the government can be provided either especially for ethnic minority groups (see for example, GOV 2005a) or generally in a variety of legal documents that include preferential treatment clauses for those with such contribution. This is a rough categorization since there are often no such clear-cut targeting in government programs. Major programs such as Program 135 (GOV 1998a and 2007b) target all the poor communes in ethnic, mountainous and remote areas, and legal documents such as the 2005 Education Law (NA 2005) stipulates the beneficiaries under all the four different channels discussed above. More remarkably, the Government of Vietnam also gives preferential treatment such as price and transportation subsidies to businesses that operate in mountainous and ethnic areas (GOV 1998c and 2002). Teachers working in these areas can be entitled to 70% salary increments (GOV 2006a), and government officials assigned to these areas can be promoted one year earlier (GOV 2006b). However, concerns have been expressed that these numerous programs may be overlapping, and may not be very efficiently and adequately supervised in their implementation (Asian Development Bank 2002, GOV 2005b, World Bank 2008b). In addition, while these programs clearly contribute to the welfare of ethnic minority groups, to our knowledge, their costs and benefits have not been evaluated.
Ethnic Minorities’ Labor and migration
Together with the strong performance in recent years, Vietnam’s economy has undergone a restructuring, including the downsizing of the agricultural sector and the increase in the wage work sector. Edmonds and Pavnick (2006) shows that trade liberalization helped reallocate labor between the households and the market in the period 1992-1998. It is possible that the same mechanism was at work in the subsequent period. Although there was a similar change in the occupation redistribution ethnic minority people - ethnic minority groups in fact have higher growth rates in the wage work sector and private sector - ethnic minority groups still appear to lag behind ethnic majority groups in all modern sectors. Workers employed in the private sector, public sectors or foreign-invested sector earn from 108% to 134% more than workers employed in the agricultural sector. While the rate of returns to education for ethnic majority workers is around 2% higher than ethnic minority workers, their rate of returns to the number of hours worked is around 6% less than ethnic minority workers. However, given that ethnic majority people have on average 2.5 more years of schooling than ethnic minority people, the former can suggest either lower quality of education or less access to better employment or more discrimination towards ethnic minority workers in the market or any combination of these factors. Perhaps the latter can be partly explained by the law of diminishing returns because ethnic minority people work two hours fewer per week than ethnic majority people (VHLSS 2006).
In fact, the earnings differential between the ethnic minority group and majority groups can be decomposed into two parts, one due to the differential in endowment and the other due to the differential in returns to endowments or wage structure. The latter part is also known to be caused by unobserved factors such as ethnic differentials in the quality of schooling, individual ability, culture or labor market discrimination. These differentials are considered in 2006 and in 1998 using three methods of decomposition: Oaxaca-Blinder, Cotton, and Oaxaca and Ransom. Differences in endowments explain from 66% to 74% of the earnings differential between the ethnic groups, while differences in the wage structure explain from 26% to 34% of the earning differential. The range of the earnings differential due to endowments decreased (or the range of the earnings differentials due to the wage structure increased) from 1998, reflecting a wider gap in the unobserved factors between ethnic groups. One such increasing factor can be increasing rates of returns to education for ethnic majority groups. Such factors can include labor market discrimination against ethnic minority groups or differentials in the quality of schooling.
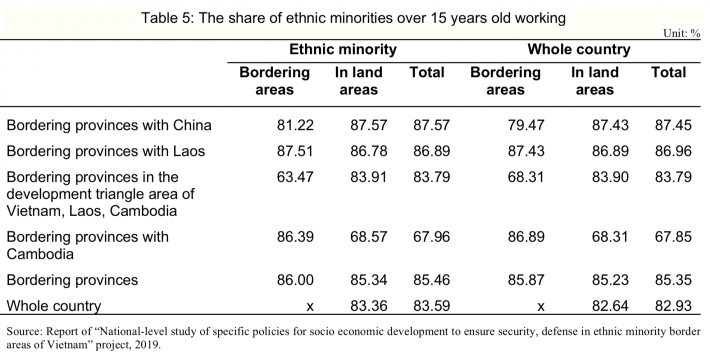
The working rate of ethnic minority was quite high, over 80%, even some areas were higher than national and regional average. In particular, the ethnic minority-labor and Kinh ethnic labor rates in bordering area with Cambodia were higher than in the inland areas (Table 5). However, almost all of ethnic minorities worked part time or seasonal jobs or self-sufficient work resulted in low income and higher risks such as agricultural exploration, trading and grocery business.
In general, the jobless rate in border areas was lower than areas without border line. The trend was accurate in border areas with China and Cambodia. However, in case of ethnic minority, the rates of jobless household in these areas also were higher than domestic area. It reported that business activities of ethnic minority faced to many challenges. Due to the fact that border areas were in difficult economic condition, high poverty rate and low income per capital contributed to the difficulty of attracting investments of companies to create permanent jobs.
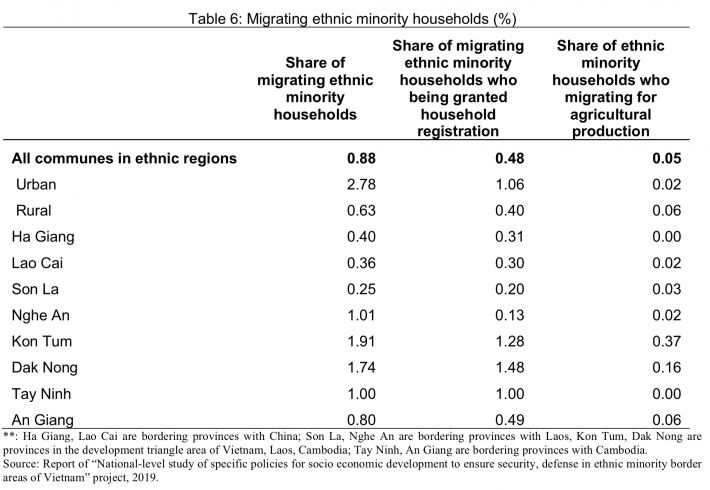
Lacking of permanent jobs was one of the reasons why ethnic minorities migrated and were nomadic in border communes, especially, situations of immigration of illegal laborers in border areas posed a challenge in terms of household-registration management. On average, only half of migrating ethnic minority household are granted household registration. This is more serious in urban area where getting household registration is more complicated, especially in big cities (Table 6).
Despite much progress in living standards, health, and education in recent years, ethnic minority groups still lag behind ethnic majority groups in Vietnam. Ethnic minority people have lower quality health care than ethnic majority groups. While there has been a restructuring for the Vietnamese economy in recent years, more than half (55%) of ethnic minority groups still work in agriculture; the corresponding number for ethnic majority groups is less than one third (30%). About two-thirds of the earnings differentials between ethnic groups can be attributed to differences in endowments, and one-third due to differences to the returns to endowments. Ethnic minority children are more likely to drop out of school and work than ethnic majority children. Despite various government assistance programs that are specially targeted at ethnic minority groups, ethnic minority people still suffer from lower utility access and household assets than ethnic majority people. Ethnic minority groups’ utility access and household assets are also lower than those for people living in rural areas, placing them as the most disadvantaged groups in the country.
Policies to level the disparities between ethnic minority groups can be roughly divided into either a short-term approach or a longer-term approach. Short-term policies arguably would take less efforts to implement and can be targeted at urgent issues, while long-term policies may take longer and more resources to come into effect. Clearly, the criteria to categorize policies are highly context-specific and can be subjective, but we believe that this division may help to focus ideas and stimulate more discussion.
Improving the well-being for ethnic minority groups would require more and sustained efforts in the long term. Several main policies can be considered such as i) emphasizing the importance of improving educational outcomes for ethnic minority groups in all development plans or government campaigns. Furthermore, education also has strong intergenerational impacts on increasing educational accomplishments for future generations. While their occupation is becoming more diversified, ethnic minority groups are still mostly occupied in agriculture. While it may not be easy to map out good strategies to change the occupation for these groups, it is important that the government include the economic development of ethnic minority groups among the top priorities in development plans. For example, tax incentives or preferential loans can be given to enterprises employing more ethnic minority people. Or special job training centers can be established in ethnic minority communes.
DATA
The study also uses migration data from Vietnam Access to Resources Household Survey (VARHS) in 2012 and 2014. The survey was jointly conducted by the Central Institute for Economic Management (CIEM) under the Ministry of Planning and Investment (MPI), the Institute of Policy and Strategy for Agriculture and Rural Development (IPSARD) under the Ministry of Agriculture and Rural Development, the Institute of Labour Science and Social Affairs (ILSSA) under the Ministry of Labor, Invalids and Social Affairs (MOLISA), the Development Economics Research Group (DERG) of the University of Copenhagen, Denmark.
The first round of VARHS was in 2002 and has been expanded to biennial survey. Since 2006, VARHS was carried out in rural areas in 12 provinces of Ha Tay, Lao Cai, Phu Tho, Dien Bien, Lai Chau, Nghe An, Quang Nam, Dak Lak, Dak Nong, Lam Dong, Khanh Hoa, and Long An.
VARHS data was chosen to analyze the relationship between migration and inequality given the other source of migration information in Vietnam is still limited. There are migration surveys by GSO in 2004 and in 2015 but results of the 2015 migration survey has not been announced yet. The key point is those migration surveys only gathered information at migrants’ destinations. The VARHS can make up for this shortage with information at the origin of the migrants.
We use two rounds of VARHS 2012 and 2014 to construct the pool of 389 rural districts and 528 rural communes sending migrants in either 2012 or 2014. In 2012, migrants are defined as those left the households in the last 5 years. In 2014, migrants are defined as those left the households in the last 2 years.
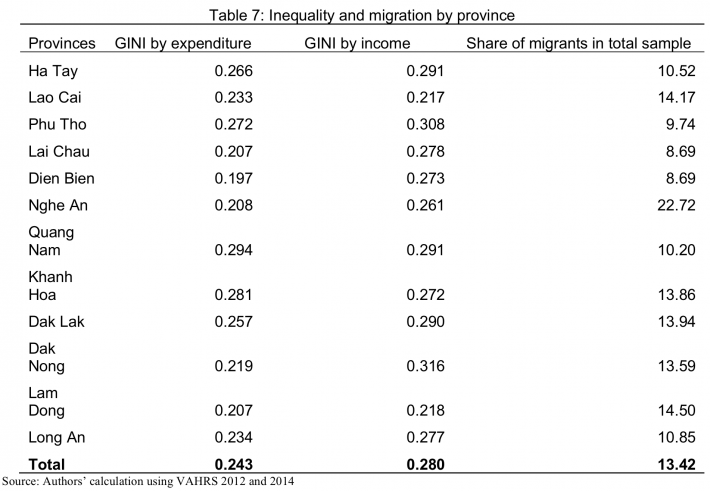
In general, the GINI coefficients by income are higher than GINI coefficients by expenditure (Table 7), which is understandable as income flows tends to vary more than consumption. In terms of income, Dak Nong and Phu Tho have GINI coefficient of 0.30, higher than the overall average. And the Central and the South have higher rate of migration than the North. Nghe An has the highest migration rate of 22.7%. Northern mountainous provinces have low migration rate of less than 10%.
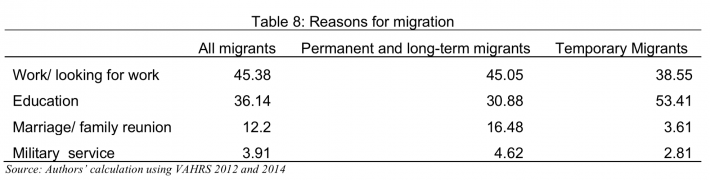
The majority of temporary or long-term migrants are those who are studying or working. Apart from that, family reunification is also an important reason, accounting for 16.5% of migrants. Military services also play a certain role, with nearly 4% of migrants on military missions (Table 8).
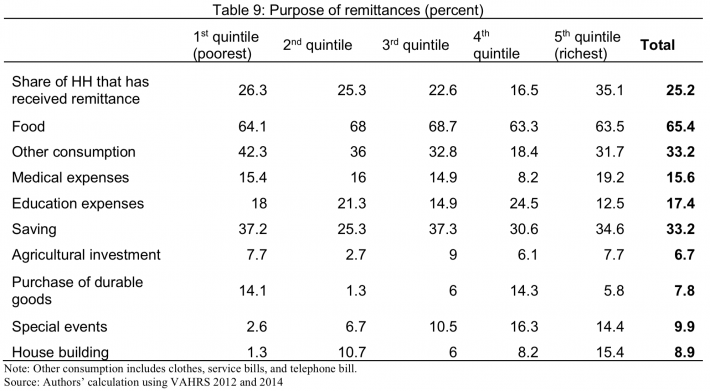
Among households sending migrants, around a quarter received remittances (23% in 2012 and 27% in 2014). The top quintile receives more remittances than the rest. Remittances are normally assumed to be an important source of investment for households on agricultural production. However, the percentage of households receiving remittances for this purpose is very low (6.7 %). Buying food (65.4%), other consumption (33.2%), and savings (33.2%) are the main purposes (Table 9).
METHODOLOGY
To measure the relationship between migration and inequality, the study uses OLS regression model to estimate the impact of migration on inequality based on data at district level from VARHS migration sample.
GINIi=β0+β1Mi+β2Ri+β3LABi+β4MARi+B5INFi+β6PBSi+β7CRi+β8INCi+β9NONFARi+ui
In which:
- GINIi: The coefficient of inequality of district i which is measured based on the average expenditure or income per capita.
- Mi: The migration rate measured by the ratio of the quantity of migrants over total population of district i (%).
- Ri: The logarithm of the total amount of money sent to district i by its migrants (thousand Vietnam dong).
- LABi: The index of the level of training of workers, including two index components: the labor index - (1) Proportion of members in working age completed vocational training, college, university or higher level; (2) Average of schooling years of household members in the working age.
- MARi
: The index of the commodity market connection, including: (1) Distance from households to input agents (km); (2) Distance from households to output agents (km)
- NFi: The infrastructure index, including: (1) The percentage of households in the district use electricity from national power grid; (2) The percentage of households in the district use clean water sources; (3) The average distance from the household to all weather roads (km)
-
PBSi : The index of public services, including: (1) Average number of times extension workers to visit households; (2) Percentage of households with irrigated land production.
-
CRi: The index of access to credit, including: (1) The average distance of the household to the formal credit institutions; (2) The loan amount per capita.
-
INCi: The logarithmic of per capita income
-
NONFARMi: The proportion of non-agricultural income (non-agricultural production excluding wages) in total income.
The sub-indexes within each index will be standardized according to a scale of 10, a specific formula is as follows:
Sub-index = (X - min)/(max - min)*10
RESULTS OF THE MODEL ON MIGRATION ASSESSMENT
As shown in Table 10, district-level GINI coefficient by expenditure per capita is 0.31 and by income per capita is 0.37, showing the moderate level of inequality, lower than the national index. This is understandable because samples for migration investigation in VARHS are mainly poor agricultural provinces where income is low and less varies across individuals than in big cities. Non-farm income is low, only accounting 11% of total household income. If including income from wage, rate of non-farm income over total income rises to 45%. Among rural connection indexes, infrastructure index has the highest average score of 9.11 points, market access index is 6.12 points, capital, labor and public service indexes are 4.87, 4.79, and 4.97 points respectively.
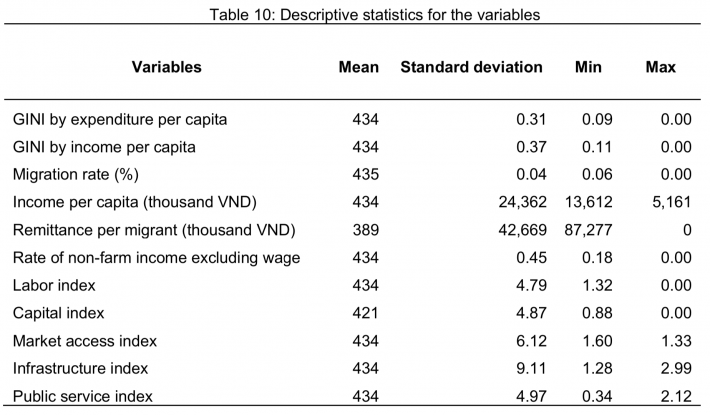
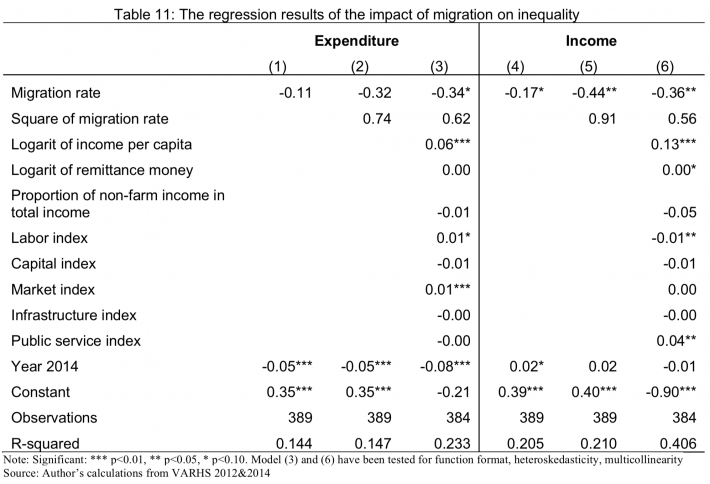
Table 11 presented regression results illustrating the impact of migration and other factors to inequality. The regression results show that migration has a positive impact on inequality, but the marginal impact is reducing, reflected by the different signs of coefficients of migration rate and migration rate squared. The impact of migration on inequality is stronger in the cases of income inequality than those of expenditure inequality. Total per capita income accompanies with the increase in inequality significantly. Meanwhile remittances seem to contribute to inequality but insignificantly.
CONCLUSION AND IMPLICATIONS
Migration
In general, there is an increasing tendency of rural migrants, but only 1/3 go to the cities and much less go to bordering areas. Migrants are more likely to be temporary, young, single people. Rural-rural migrants are more likely the phenomena of disadvantaged ethnic minorities. Besides, migrants are more likely to get “informal” jobs and do not have equal access to social services in big cities.
Remittances not only help migrant households to improve income and expenditure significantly, but also to reduce rural inequality under the limitation of agricultural land and rural non-farm employment. Remittances help to cope with shocks, and mostly spent on current consumption. Results show that very little spent on investments, both farm and non-farm activities in rural areas. With remittances, middle quintile tends to save less and spend less on building house but more on education and health than the poorest and richest quintiles
Basing on analytical results, policy solutions for internal migration are as follows:
- Improve both farm and non-farm investment opportunities in rural areas, especially bordering areas – which is strategic in terms of national security in;
- More targets in infrastructure development and social services: commercial farms, commodity market connectivity, enabling rural business, promoting rural start-up business, improved quality of vocational training for young people, special targeted social services for the poor and ethnic minorities.
- Upgrade skills of ethnic minority farmers, through agricultural extension and communication
- Invest in improved vocational training, experiential learning, and formation of other skills of the ethnic minority youth to prepare them for nonfarm jobs
- Develop secondary cities to create jobs near rural populations
- Remove restrictions to internal migration
Migration and agriculture and rural development
In the process of development, Vietnam has made great achievements such as high growth accompanied by rapid poverty reduction. Success factors of poverty reduction are good agricultural growth and fairly equal distribution.
The income gap between urban and rural areas tends to decrease, urban inequality reduced but rural inequality increased. The rural migration has increasing trend but only a third of them moves to the city and few comes to bordering areas.
Remittances are to cope with shocks and primarily for current consumption expenditure such as food, other consumption and very few are allocated for investment on neither agricultural nor non-agricultural sectors in rural areas. Migrants are more likely to be temporary including young, single and rich people.
The communes who have high migration rate have lower inequality. At the same time, the communes having better connections on commodity market and labor are more likely to achieve equality.
Some policy recommendations are:
- Improve access in terms of market, education, infrastructure for internal migrants;
- Improve the investment opportunities in destination areas for both agricultural and non-agricultural sectors;
- More targeted approach should be developed in infrastructure development and provision of social services: commercial farms, commodity market connectivity, enabling rural business, promoting rural start-up business, improved quality of vocational training for young people, special targeted social services for the poor and ethnic minorities.
ACKNOWLEDGEMENT
Authors would like to thanks for financial support from the 2016-2018 national-level study of “Specific policies for socio economic development to ensure security, defense in ethnic minority border areas of Vietnam” under the 2016-2020 National Science and Technology Program of “Key issues on ethnic minorities and ethnic policies in Vietnam to 2030”
REFERENCES
Adams, Walter (1969). The Brain Drain. Palgave Macmilllan, New York.
Asian Development Bank. (2002). Indigenous peoples/ethnic minorities and poverty reduction Vietnam. Manila: Philippines. Environment and Social Safeguard Division, Regional and Sustainable Development Department.
Baulch, Bob, Truong Thi Kim Chuyen, Dominique Haughton and Jonathan Haughton (2007). ―Ethnic Minority Development in Vietnam‖. Journal of Development Studies 43(7): 1151-1176.
Dang Nguyen Anh (2003), Internal migration policies in the ESCAP region, Asia-Pacific Population Journal, vol. 18, no. 3, pp. 27-40.
Dang Nguyen Anh (2009), Background report on migration, Project KX.01.09/06-10 on Some issues of Vietnam’s rural area in the new context, Program KX.01/06-10.
Dang, Nghiem Van, Chu Thai Son and Le Hung (2000). Ethnic Minorities in Vietnam. Hanoi, Vietnam: The Gioi Publishers.
Gallup, John Luke. (2004). The wage labor market and inequality in Vietnam, in Economic growth, poverty and household welfare in Vietnam, Eds. Paul Glewwe, Nisha Agrawal, and David Dollar. Washington, D.C.: The World Bank, 53-93.
General Statistics Office (2005), The 2004 Vietnam migration survey: major findings, Statistical Publishing House.
General Statistics Office (2006), The 2004 Vietnam migration survey: the quality of life of migrants, Statistical Publishing House.
General Statistics Office (2010), The 2009 Vietnam Population and Housing Census: Major findings, Statistical Publishing House.
General Statistics Office (2011), Vietnam population prospects: 2009-2049, Statistical Publishing House.
General Statistics Office (2013), Result of the Vietnam Household Living Standards Survey 2012, Statistical Publishing House.
General Statistics Office (2016), Statistics, http://www.gso.gov.vn.
Hein de Haas (2007), “Remittances, migration and social development”.
Institute of Policy and Strategy for Agriculture and Rural Development (2019), Report of “National-level study of specific policies for socio economic development to ensure security, defense in ethnic minority border areas of Vietnam” project.
Le, Bach Duong, Tran Giang Linh, and Nguyen Thi Phuong Thao (2011), Social protection for rural - urban migrants in Vietnam: current situation, challenges and opportunities, research report no. 8, Centre for Social Protection, viewed 5 May 2014, .
Lipton, Michael (1980), Migration from rural areas of poor countries: The impact on rural productivity and income distribution, World Development, 1980, vol. 8, issue 1, pages 1-24.
Nguyen, Binh, James Albrecht, Susan Vroman, and Daniel Westbrook (2007), A quantile regression decomposition of urban - rural inequality in Vietnam, Journal of Development Economics, vol. 83, issue 2, pp. 466-490.
Todaro, Michael (1969), A model of labour migration and urban unemployment in less developed countries, American Economic Review, vol. 59, no. 1, pp. 138-148.
Tran, Ngoc Them. (2001). ―Tim ve Ban Sac Van Hoa Viet Nam‖ (Discovering the Identity of Vietnamese Culture.) Ho Chi Minh City, Vietnam: Ho Chi Minh City Publishing House.
United Nations Development Group. (2008). "United Nations Development Group Guidelines on Indigenous Peoples' Issues." Accessed November 2009 at http://www2.ohchr.org/english/issues/indigenous/docs/guidelines.pdf
Van de Walle, Dominique and Dileni Gunewardena (2001). ―Sources of Ethnic Inequality in Vietnam.‖ Journal of Development Economics. 65: 177-207.
World Bank (2016), World Bank national accounts data and OECD National Accounts data, http://data.worldbank.org.
Date submitted: September 11, 2019
Reviewed, edited and uploaded: October 25, 2019 |
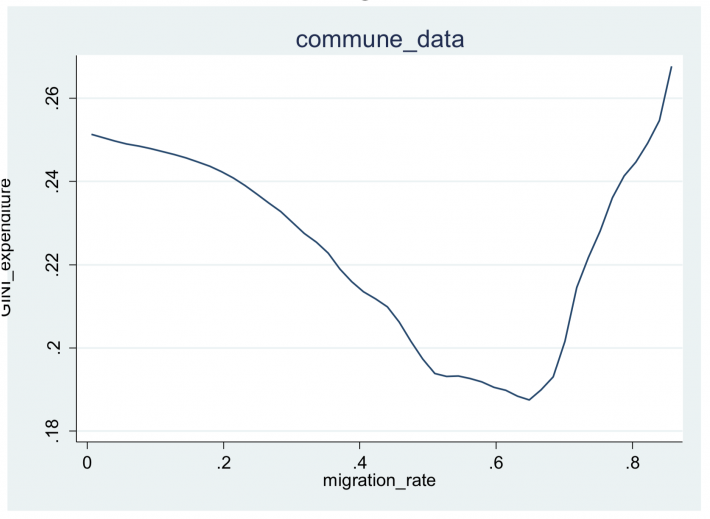
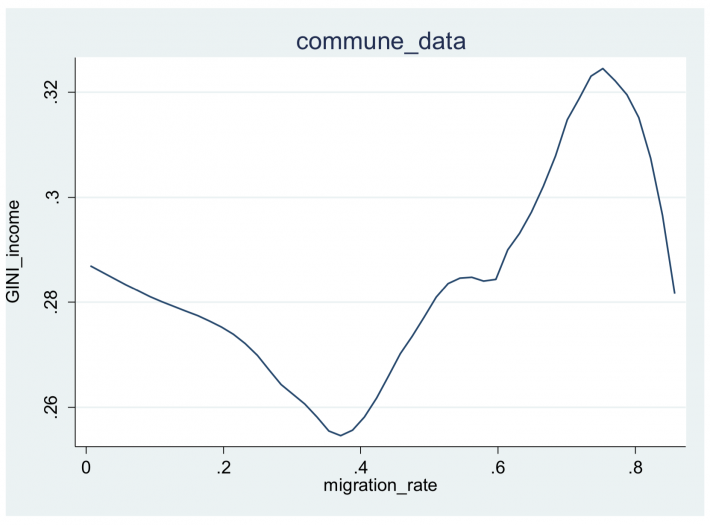
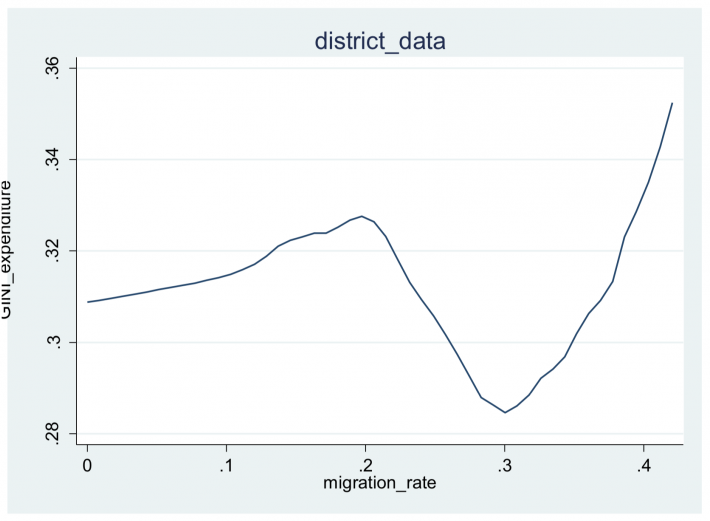
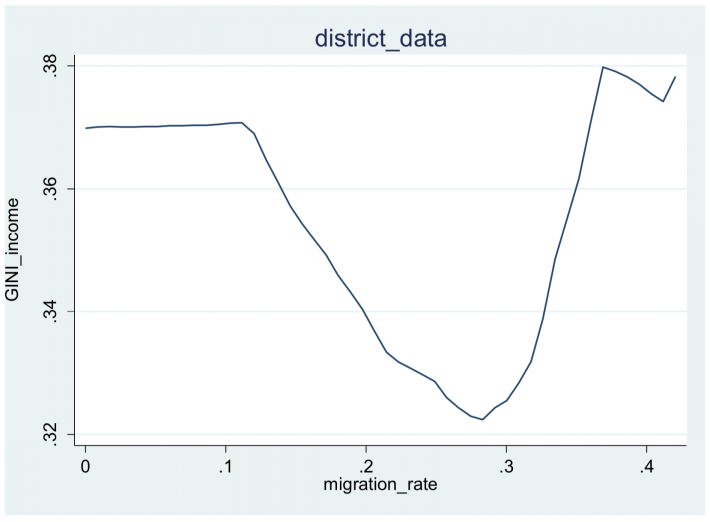
Appendix – Correlation between GINI and migration rate at commune and district levels

The Review of Economic Policy in Rural Development with a Focus of the Ethnic Minority People in Vietnam
ABSTRACT
Over 30 years since the reform policy, Vietnam has been successfully transformed from a central planning to a market-oriented economy, and from a low income to a middle-income country. The poverty rate reduced sharply and the general inequality index has been stable. However, there is a persistent separation between urban and rural areas, inland and bordering areas, ethnic minorities and the Kinh. In theory, migration could either help balance the inequality through wage equalization or increase inequality as a consequence of “brain drain.” We use the panel data of 2,740 households from the Vietnam Access to Resources Household Survey to analyze the correlation of migration and inequality. The results provide evidence that migration has a positive impact on reducing inequality in Vietnam but such impact is expected to be reduced as the communities become more equal. Policy implications are improving inter-regional linkages and removing migration restrictions to tackle regional separation and inequality.
Key words: Migration, ethnicity minorities, inequality, Vietnam
INTRODUCTION
After nearly 30 years of reform, Vietnam has made outstanding economic and social achievements. Between 1986 and 2015, Vietnam’s average economic growth was about 6.52%, one of the fastest growth rates in the world. The poverty rate dropped from 28.9 in 2002 to 8.4% in 2014 (GSO 2016). The rural poverty rate felt quicker than the urban one, keeping inequality in check. Gini coefficient has been kept at 0.42 - 0.43 since 2002.
However, the inter-regional income gap is still significant. The urban/ rural income ratio is almost 2 in 2014 (GSO 2016). The poverty rate of bordering area has doubled that of inland. Migration might help to narrow this gap if wage equalization between areas is enabled (Todaro 1969). However, this might not happen due to the "brain drain" phenomenon (Adam 1969) and the fixed cost of migration that prevents the poor from migrating (Lipton 1980).
This paper uses the 2012-2014 panel of 2,740 households from Vietnam Access to Resources Household Survey (VARHS) to estimate the impact of migration on inequality at migrant-sending rural areas.
GROWTH, POVERTY AND INEQUALITY IN VIETNAM
From a poor country in the 1980s, Vietnam has become a middle-income country. In 2015, the average GDP per capita is around US$2,200 at current prices, equivalent to about US$6,000 on purchasing power parity. The growth rate of GDP per capita of Vietnam was 5.5 per cent/ year in 1990-2015, contributing to three-and-a-half time increase in average income on purchasing power parity (World Bank 2016).
The economic growth has been broad-based, contributing to the sharp decrease in the poverty rate. However, poverty rate in rural areas was significantly higher and reduced slower than in urban areas. In 2016, the rural poverty rate was almost 4 times higher than the urban one. Poverty concentrates in ethnic minorities (in 2017, more than half of poor households are ethnic minorities ones). There is also significant difference in the poverty rates across regions. The two regions with the highest poverty rate are the North Mountainous Area and Central Highlands, where most of ethnic minorities live (Table 1).
Noteworthily, particularly, according to the “National-level study of specific policies for socio economic development to ensure security, defense in ethnic minority border areas of Vietnam project,” the rate of ethnic minority household of total households varies significantly among bordering areas. In 2017, almost all of poverty households in bordering provinces with China was ethnic minorities (95.2%) whereas that of bordering provinces with Cambodia is only 17.1% (Table 2). The poorest ethnic groups in the bordering areas with China are La Hu, Mang, Lo Lo, in the bordering area with Lao is Kho Mu; in the bordering areas with Cambodia is Khmer.
Noteworthily, in contrast with the decrease of inequality in urban areas, the inequality in rural areas was at the increasing trend from 0.36 in 2002 to 0.41 in 2012. The North East and North West are not only the poorest regions but also those having the highest inequality level recently (Table 3).
MIGRATION IN VIETNAM
Rural – urban migration
The 2009 Population and Housing Census showed that the number of migrants in 2009 was 6.5 million, a 2.3 fold increase since 1999. Between the two censuses, the share of migrants increases in both urban (15.3 to 16.3%) and rural areas (2.8 to 5.0%). The majority of migrants were from rural areas, in which, rural-urban migrants accounted for nearly one third of total number of migrants (Table 4).
Vietnam is considered to be having a rapid urbanization process. The share of urban population in total population was 34% in 2015 (GSO 2016), up from 20% in 1986 (GSO 2004). A considerable part of this urban population expansion comes from rural - urban migrants. From 1999 to 2009, rural - urban migration contributed to raise the population growth rate in urban area to 3.4% and reduce the population growth rate in rural area to 0.4% per year, while there is little difference in the birth and death rates between the two areas (GSO 2010). In 2009, 16% of urban population are migrants who moved there in less than 5 years (GSO 2010).
The Government of Vietnam set to increase the urban population to 50% of total population by 2025. It seems to be an ambitious plan, though. Given the current age structure and patterns of birth, mortality, and immigration rates, the urban share of population would only reach 50% by 2035-2040 (GSO 2011).
The government might have counted on the accelerated rural - urban migration flow in setting up the urbanization target. However, Dang (2009) argues that the state development programs disregard or aim to limit migration. Specially, residency-based social policies are making rural - urban migrants marginalized (Le et al. 2011).
ASSESSMENT OF MIGRATION AND ETHNICITY EMPLOYMENT
Vietnam has 54 ethnic groups. Most of Vietnam’s ethnic minorities live in remote, lightly populated mountain regions in northern, central and western Vietnam. The largest minorities in the north are the Tay (1.6% of the Vietnamese population), Muong (1.4%), Tai (1.2%), Nung (1%) and others (2.3) %). The main minorities in the south are Chinese, Montagnard (1.5%), Khmer (1.2%) and Cham (0.1%).
Almost all their languages belong to the five language families of Southeast Asia and they can be considered as sharing ―the same historical and cultural horizon of the past which spread from south of the Yangtze River to the Islands of Southeast Asia‖ (Dang et al. 2000). Some of these groups have been in Vietnam since the earliest times (for example, the Viet, the Tay-Thai groups), while some arrived as recently as around the 17th to 19th centuries (for example, the Hanhi, the Lahu, the Lolo groups) and some came to Vietnam throughout different periods, but mostly in the last millennium (for example, the Hoa, the Nung, the Vankieu groups) (Dang et al., 2000.) The Kinh or Viet (ethnic Vietnamese) is the largest group, accounting for 86% of the population. The next largest groups are the Tay, the Thai, the Muong, the Khmer (ethnic Cambodian), the Hoa (ethnic Chinese), and the Hmong, which together represent 10% of the population, and the remaining ethnic groups make up 4% of the population (GSO 2001a).
The World Bank, in its Country Social Analysis report (World Bank 2009), identifies six areas where ethnic minorities have a disadvantage compared with ethnic majorities:
Government Policies and Programs for Ethnic Minorities to create jobs, reduce poverty
The Government of Vietnam (GOV) has paid much attention to the welfare of ethnic minority groups. There is a ministerial-level government body, the Committee for Ethnic Minority and Mountainous Area Affairs (CEMA), which is in charge of management functions for ethnic minorities and mountainous areas. In geographically strategic areas or areas with an ethnic minority population of 5,000 or more, CEMA has its own representative agency down to the district-level (GOV 2004a). Programs that specially target ethnic minority groups are numerous and diverse. These programs are diverse and cover a wide range of issues including poverty reduction, resettlement and sedentarization, forest land allocation, education, health and communication. They benefit those minority groups through several channels such as: i) their ethnic identity; ii) their (usually mountainous or remote) residence areas; iii) their (usually poor) economic status; and iv) general social programs for households with war martyrs, war invalids or recognized as having contributed to the government. Programs that target ethnic minority groups through ethnic identity include such activities as cash subsidies on land reclamation, house construction, and drinking water improvement (GOV 2004b), cash grants on food, production tools and seedlings (GOV 1995), and interest-free loans for poor households (GOV 2007a). Programs that target ethnic minority groups through their residence areas include such activities as improving commune and village infrastructure, developing communal centers, planning residential areas, providing agricultural extension services, and training commune level cadres (GOV 1998a and 2007b). Programs that target ethnic minority groups through their poor economic status include activities such as reducing poverty rates and creating jobs (GOV 1998b and 2001). And programs that target ethnic minority groups through their contribution to the wars or the government can be provided either especially for ethnic minority groups (see for example, GOV 2005a) or generally in a variety of legal documents that include preferential treatment clauses for those with such contribution. This is a rough categorization since there are often no such clear-cut targeting in government programs. Major programs such as Program 135 (GOV 1998a and 2007b) target all the poor communes in ethnic, mountainous and remote areas, and legal documents such as the 2005 Education Law (NA 2005) stipulates the beneficiaries under all the four different channels discussed above. More remarkably, the Government of Vietnam also gives preferential treatment such as price and transportation subsidies to businesses that operate in mountainous and ethnic areas (GOV 1998c and 2002). Teachers working in these areas can be entitled to 70% salary increments (GOV 2006a), and government officials assigned to these areas can be promoted one year earlier (GOV 2006b). However, concerns have been expressed that these numerous programs may be overlapping, and may not be very efficiently and adequately supervised in their implementation (Asian Development Bank 2002, GOV 2005b, World Bank 2008b). In addition, while these programs clearly contribute to the welfare of ethnic minority groups, to our knowledge, their costs and benefits have not been evaluated.
Ethnic Minorities’ Labor and migration
Together with the strong performance in recent years, Vietnam’s economy has undergone a restructuring, including the downsizing of the agricultural sector and the increase in the wage work sector. Edmonds and Pavnick (2006) shows that trade liberalization helped reallocate labor between the households and the market in the period 1992-1998. It is possible that the same mechanism was at work in the subsequent period. Although there was a similar change in the occupation redistribution ethnic minority people - ethnic minority groups in fact have higher growth rates in the wage work sector and private sector - ethnic minority groups still appear to lag behind ethnic majority groups in all modern sectors. Workers employed in the private sector, public sectors or foreign-invested sector earn from 108% to 134% more than workers employed in the agricultural sector. While the rate of returns to education for ethnic majority workers is around 2% higher than ethnic minority workers, their rate of returns to the number of hours worked is around 6% less than ethnic minority workers. However, given that ethnic majority people have on average 2.5 more years of schooling than ethnic minority people, the former can suggest either lower quality of education or less access to better employment or more discrimination towards ethnic minority workers in the market or any combination of these factors. Perhaps the latter can be partly explained by the law of diminishing returns because ethnic minority people work two hours fewer per week than ethnic majority people (VHLSS 2006).
In fact, the earnings differential between the ethnic minority group and majority groups can be decomposed into two parts, one due to the differential in endowment and the other due to the differential in returns to endowments or wage structure. The latter part is also known to be caused by unobserved factors such as ethnic differentials in the quality of schooling, individual ability, culture or labor market discrimination. These differentials are considered in 2006 and in 1998 using three methods of decomposition: Oaxaca-Blinder, Cotton, and Oaxaca and Ransom. Differences in endowments explain from 66% to 74% of the earnings differential between the ethnic groups, while differences in the wage structure explain from 26% to 34% of the earning differential. The range of the earnings differential due to endowments decreased (or the range of the earnings differentials due to the wage structure increased) from 1998, reflecting a wider gap in the unobserved factors between ethnic groups. One such increasing factor can be increasing rates of returns to education for ethnic majority groups. Such factors can include labor market discrimination against ethnic minority groups or differentials in the quality of schooling.
The working rate of ethnic minority was quite high, over 80%, even some areas were higher than national and regional average. In particular, the ethnic minority-labor and Kinh ethnic labor rates in bordering area with Cambodia were higher than in the inland areas (Table 5). However, almost all of ethnic minorities worked part time or seasonal jobs or self-sufficient work resulted in low income and higher risks such as agricultural exploration, trading and grocery business.
In general, the jobless rate in border areas was lower than areas without border line. The trend was accurate in border areas with China and Cambodia. However, in case of ethnic minority, the rates of jobless household in these areas also were higher than domestic area. It reported that business activities of ethnic minority faced to many challenges. Due to the fact that border areas were in difficult economic condition, high poverty rate and low income per capital contributed to the difficulty of attracting investments of companies to create permanent jobs.
Lacking of permanent jobs was one of the reasons why ethnic minorities migrated and were nomadic in border communes, especially, situations of immigration of illegal laborers in border areas posed a challenge in terms of household-registration management. On average, only half of migrating ethnic minority household are granted household registration. This is more serious in urban area where getting household registration is more complicated, especially in big cities (Table 6).
Despite much progress in living standards, health, and education in recent years, ethnic minority groups still lag behind ethnic majority groups in Vietnam. Ethnic minority people have lower quality health care than ethnic majority groups. While there has been a restructuring for the Vietnamese economy in recent years, more than half (55%) of ethnic minority groups still work in agriculture; the corresponding number for ethnic majority groups is less than one third (30%). About two-thirds of the earnings differentials between ethnic groups can be attributed to differences in endowments, and one-third due to differences to the returns to endowments. Ethnic minority children are more likely to drop out of school and work than ethnic majority children. Despite various government assistance programs that are specially targeted at ethnic minority groups, ethnic minority people still suffer from lower utility access and household assets than ethnic majority people. Ethnic minority groups’ utility access and household assets are also lower than those for people living in rural areas, placing them as the most disadvantaged groups in the country.
Policies to level the disparities between ethnic minority groups can be roughly divided into either a short-term approach or a longer-term approach. Short-term policies arguably would take less efforts to implement and can be targeted at urgent issues, while long-term policies may take longer and more resources to come into effect. Clearly, the criteria to categorize policies are highly context-specific and can be subjective, but we believe that this division may help to focus ideas and stimulate more discussion.
Improving the well-being for ethnic minority groups would require more and sustained efforts in the long term. Several main policies can be considered such as i) emphasizing the importance of improving educational outcomes for ethnic minority groups in all development plans or government campaigns. Furthermore, education also has strong intergenerational impacts on increasing educational accomplishments for future generations. While their occupation is becoming more diversified, ethnic minority groups are still mostly occupied in agriculture. While it may not be easy to map out good strategies to change the occupation for these groups, it is important that the government include the economic development of ethnic minority groups among the top priorities in development plans. For example, tax incentives or preferential loans can be given to enterprises employing more ethnic minority people. Or special job training centers can be established in ethnic minority communes.
DATA
The study also uses migration data from Vietnam Access to Resources Household Survey (VARHS) in 2012 and 2014. The survey was jointly conducted by the Central Institute for Economic Management (CIEM) under the Ministry of Planning and Investment (MPI), the Institute of Policy and Strategy for Agriculture and Rural Development (IPSARD) under the Ministry of Agriculture and Rural Development, the Institute of Labour Science and Social Affairs (ILSSA) under the Ministry of Labor, Invalids and Social Affairs (MOLISA), the Development Economics Research Group (DERG) of the University of Copenhagen, Denmark.
The first round of VARHS was in 2002 and has been expanded to biennial survey. Since 2006, VARHS was carried out in rural areas in 12 provinces of Ha Tay, Lao Cai, Phu Tho, Dien Bien, Lai Chau, Nghe An, Quang Nam, Dak Lak, Dak Nong, Lam Dong, Khanh Hoa, and Long An.
VARHS data was chosen to analyze the relationship between migration and inequality given the other source of migration information in Vietnam is still limited. There are migration surveys by GSO in 2004 and in 2015 but results of the 2015 migration survey has not been announced yet. The key point is those migration surveys only gathered information at migrants’ destinations. The VARHS can make up for this shortage with information at the origin of the migrants.
We use two rounds of VARHS 2012 and 2014 to construct the pool of 389 rural districts and 528 rural communes sending migrants in either 2012 or 2014. In 2012, migrants are defined as those left the households in the last 5 years. In 2014, migrants are defined as those left the households in the last 2 years.
In general, the GINI coefficients by income are higher than GINI coefficients by expenditure (Table 7), which is understandable as income flows tends to vary more than consumption. In terms of income, Dak Nong and Phu Tho have GINI coefficient of 0.30, higher than the overall average. And the Central and the South have higher rate of migration than the North. Nghe An has the highest migration rate of 22.7%. Northern mountainous provinces have low migration rate of less than 10%.
The majority of temporary or long-term migrants are those who are studying or working. Apart from that, family reunification is also an important reason, accounting for 16.5% of migrants. Military services also play a certain role, with nearly 4% of migrants on military missions (Table 8).
Among households sending migrants, around a quarter received remittances (23% in 2012 and 27% in 2014). The top quintile receives more remittances than the rest. Remittances are normally assumed to be an important source of investment for households on agricultural production. However, the percentage of households receiving remittances for this purpose is very low (6.7 %). Buying food (65.4%), other consumption (33.2%), and savings (33.2%) are the main purposes (Table 9).
METHODOLOGY
To measure the relationship between migration and inequality, the study uses OLS regression model to estimate the impact of migration on inequality based on data at district level from VARHS migration sample.
GINIi=β0+β1Mi+β2Ri+β3LABi+β4MARi+B5INFi+β6PBSi+β7CRi+β8INCi+β9NONFARi+ui
In which:
: The index of the commodity market connection, including: (1) Distance from households to input agents (km); (2) Distance from households to output agents (km)
PBSi : The index of public services, including: (1) Average number of times extension workers to visit households; (2) Percentage of households with irrigated land production.
CRi: The index of access to credit, including: (1) The average distance of the household to the formal credit institutions; (2) The loan amount per capita.
INCi: The logarithmic of per capita income
NONFARMi: The proportion of non-agricultural income (non-agricultural production excluding wages) in total income.
The sub-indexes within each index will be standardized according to a scale of 10, a specific formula is as follows:
Sub-index = (X - min)/(max - min)*10
RESULTS OF THE MODEL ON MIGRATION ASSESSMENT
As shown in Table 10, district-level GINI coefficient by expenditure per capita is 0.31 and by income per capita is 0.37, showing the moderate level of inequality, lower than the national index. This is understandable because samples for migration investigation in VARHS are mainly poor agricultural provinces where income is low and less varies across individuals than in big cities. Non-farm income is low, only accounting 11% of total household income. If including income from wage, rate of non-farm income over total income rises to 45%. Among rural connection indexes, infrastructure index has the highest average score of 9.11 points, market access index is 6.12 points, capital, labor and public service indexes are 4.87, 4.79, and 4.97 points respectively.
Table 11 presented regression results illustrating the impact of migration and other factors to inequality. The regression results show that migration has a positive impact on inequality, but the marginal impact is reducing, reflected by the different signs of coefficients of migration rate and migration rate squared. The impact of migration on inequality is stronger in the cases of income inequality than those of expenditure inequality. Total per capita income accompanies with the increase in inequality significantly. Meanwhile remittances seem to contribute to inequality but insignificantly.
CONCLUSION AND IMPLICATIONS
Migration
In general, there is an increasing tendency of rural migrants, but only 1/3 go to the cities and much less go to bordering areas. Migrants are more likely to be temporary, young, single people. Rural-rural migrants are more likely the phenomena of disadvantaged ethnic minorities. Besides, migrants are more likely to get “informal” jobs and do not have equal access to social services in big cities.
Remittances not only help migrant households to improve income and expenditure significantly, but also to reduce rural inequality under the limitation of agricultural land and rural non-farm employment. Remittances help to cope with shocks, and mostly spent on current consumption. Results show that very little spent on investments, both farm and non-farm activities in rural areas. With remittances, middle quintile tends to save less and spend less on building house but more on education and health than the poorest and richest quintiles
Basing on analytical results, policy solutions for internal migration are as follows:
Migration and agriculture and rural development
In the process of development, Vietnam has made great achievements such as high growth accompanied by rapid poverty reduction. Success factors of poverty reduction are good agricultural growth and fairly equal distribution.
The income gap between urban and rural areas tends to decrease, urban inequality reduced but rural inequality increased. The rural migration has increasing trend but only a third of them moves to the city and few comes to bordering areas.
Remittances are to cope with shocks and primarily for current consumption expenditure such as food, other consumption and very few are allocated for investment on neither agricultural nor non-agricultural sectors in rural areas. Migrants are more likely to be temporary including young, single and rich people.
The communes who have high migration rate have lower inequality. At the same time, the communes having better connections on commodity market and labor are more likely to achieve equality.
Some policy recommendations are:
ACKNOWLEDGEMENT
Authors would like to thanks for financial support from the 2016-2018 national-level study of “Specific policies for socio economic development to ensure security, defense in ethnic minority border areas of Vietnam” under the 2016-2020 National Science and Technology Program of “Key issues on ethnic minorities and ethnic policies in Vietnam to 2030”
REFERENCES
Adams, Walter (1969). The Brain Drain. Palgave Macmilllan, New York.
Asian Development Bank. (2002). Indigenous peoples/ethnic minorities and poverty reduction Vietnam. Manila: Philippines. Environment and Social Safeguard Division, Regional and Sustainable Development Department.
Baulch, Bob, Truong Thi Kim Chuyen, Dominique Haughton and Jonathan Haughton (2007). ―Ethnic Minority Development in Vietnam‖. Journal of Development Studies 43(7): 1151-1176.
Dang Nguyen Anh (2003), Internal migration policies in the ESCAP region, Asia-Pacific Population Journal, vol. 18, no. 3, pp. 27-40.
Dang Nguyen Anh (2009), Background report on migration, Project KX.01.09/06-10 on Some issues of Vietnam’s rural area in the new context, Program KX.01/06-10.
Dang, Nghiem Van, Chu Thai Son and Le Hung (2000). Ethnic Minorities in Vietnam. Hanoi, Vietnam: The Gioi Publishers.
Gallup, John Luke. (2004). The wage labor market and inequality in Vietnam, in Economic growth, poverty and household welfare in Vietnam, Eds. Paul Glewwe, Nisha Agrawal, and David Dollar. Washington, D.C.: The World Bank, 53-93.
General Statistics Office (2005), The 2004 Vietnam migration survey: major findings, Statistical Publishing House.
General Statistics Office (2006), The 2004 Vietnam migration survey: the quality of life of migrants, Statistical Publishing House.
General Statistics Office (2010), The 2009 Vietnam Population and Housing Census: Major findings, Statistical Publishing House.
General Statistics Office (2011), Vietnam population prospects: 2009-2049, Statistical Publishing House.
General Statistics Office (2013), Result of the Vietnam Household Living Standards Survey 2012, Statistical Publishing House.
General Statistics Office (2016), Statistics, http://www.gso.gov.vn.
Hein de Haas (2007), “Remittances, migration and social development”.
Institute of Policy and Strategy for Agriculture and Rural Development (2019), Report of “National-level study of specific policies for socio economic development to ensure security, defense in ethnic minority border areas of Vietnam” project.
Le, Bach Duong, Tran Giang Linh, and Nguyen Thi Phuong Thao (2011), Social protection for rural - urban migrants in Vietnam: current situation, challenges and opportunities, research report no. 8, Centre for Social Protection, viewed 5 May 2014,.
Lipton, Michael (1980), Migration from rural areas of poor countries: The impact on rural productivity and income distribution, World Development, 1980, vol. 8, issue 1, pages 1-24.
Nguyen, Binh, James Albrecht, Susan Vroman, and Daniel Westbrook (2007), A quantile regression decomposition of urban - rural inequality in Vietnam, Journal of Development Economics, vol. 83, issue 2, pp. 466-490.
Todaro, Michael (1969), A model of labour migration and urban unemployment in less developed countries, American Economic Review, vol. 59, no. 1, pp. 138-148.
Tran, Ngoc Them. (2001). ―Tim ve Ban Sac Van Hoa Viet Nam‖ (Discovering the Identity of Vietnamese Culture.) Ho Chi Minh City, Vietnam: Ho Chi Minh City Publishing House.
United Nations Development Group. (2008). "United Nations Development Group Guidelines on Indigenous Peoples' Issues." Accessed November 2009 at http://www2.ohchr.org/english/issues/indigenous/docs/guidelines.pdf
Van de Walle, Dominique and Dileni Gunewardena (2001). ―Sources of Ethnic Inequality in Vietnam.‖ Journal of Development Economics. 65: 177-207.
World Bank (2016), World Bank national accounts data and OECD National Accounts data, http://data.worldbank.org.
Reviewed, edited and uploaded: October 25, 2019
Appendix – Correlation between GINI and migration rate at commune and district levels